The paper, accepted for publication in Physical Review D in April, presents the first measurement of Υ (Upsilon) production at a centre-of-mass collision energy of 7 TeV at the LHC. It is also the first analysis from CMS to be accepted for publication in that journal. The analysis is based on di-muon signals in 3 pb-1 of pp data. Preliminary results were presented at last summer's ICHEP conference in Paris, using the entire dataset then available, which was smaller by a factor of 10 compared to the paper just published.
At the LHC, collisions between a quark or gluon in one proton and an antiquark or gluon in the other convert energy into mass. If there is at least 10 GeV of energy – ten proton masses – a b-quark pair may be created. A Υ particle is a meson consisting of a b-quark and its anti-particle tightly orbiting one another. How tight determines whether the particle is a Υ(1S), Υ(2S) or Υ(3S) – three of the states in which this particle may exist. Upsilons form when a b-quark and anti-b-quark combine instead of flying apart. The motivations for studying the Υ at CMS are twofold:
1. Learning about the strong force. By studying how b-quarks are created and combine to form a Υ in energetic collisions we learn about the strong force that binds quarks into hadrons. The process occurs at energies (around 10 GeV) where QCD calculations can be carried out with sufficient precision. Although the Υ was discovered more than 30 years ago (1977, Fermilab), the production mechanism is not well understood. Discrepancies exist between experimental measurements and model predictions of production cross-sections (rates) and polarisation. The CMS data at a higher energy than previous measurements can shed new light on this long-standing mystery.
2. Standard candle. The Υ(nS) family of resonances, together with J/Ψ and Z, constitute very useful detector and analysis calibration tools.
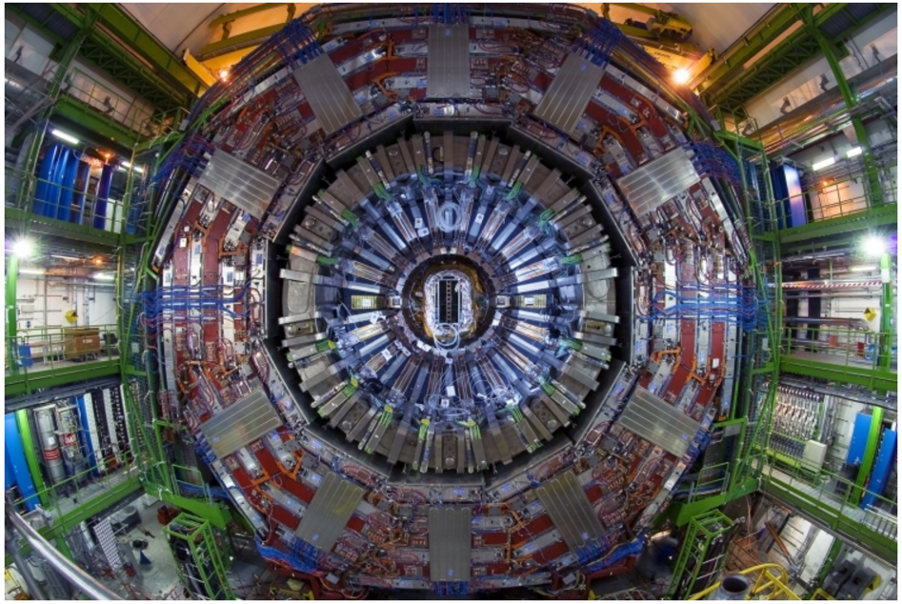
In 7 TeV collisions, a b-quark is produced once every few hundred collisions. In the two trillion collisions produced in the heart of CMS in 2010, there are billions of b-quark pairs, including about 20 million Υs. We can find them most easily when the Υ undergoes radioactive decay to a pair of muons. This happens about 2.5% of the time. Therefore about 500,000 of these decays were produced in the CMS detector. Then, if both muons passed through the sensitive volume of the detector and do not disappear down the beam pipe, there is a good chance that we can trigger on them (trigger efficiency), that the muons have left sufficient information in the detector for their trajectories to be measured (track reconstruction efficiency) and that an association between the tracker information and the muon system can be made (muon identification efficiency).
CMS has taken full advantage of the relatively low peak-luminosity of the LHC at start-up. In particular, the experiment successfully employed highly-efficient low-momentum threshold double-muon triggers, to collect the dataset used for the measurement.
The measured differential cross-section, as a function of pT, for each Υ(nS) resonance state.
The data-analysis strategy relies on employing data-based techniques wherever possible. A track-embedding techniquei is used to measure the muon track-reconstruction efficiencies, while the trigger and muon identification efficiencies are assessed via the tag-and-probe analysis techniqueii using muons from the decay of the abundant J/Ψ resonance. Monte Carlo simulation is used for comparison of results and estimation of the detector acceptance for Υ events. Relying on the data to determine the efficiencies was important to making the measurement, because, at the beginning of data-taking, the Monte Carlo did not capture all features of the detector it was modelling; it would have led to erroneous results had we relied on it.
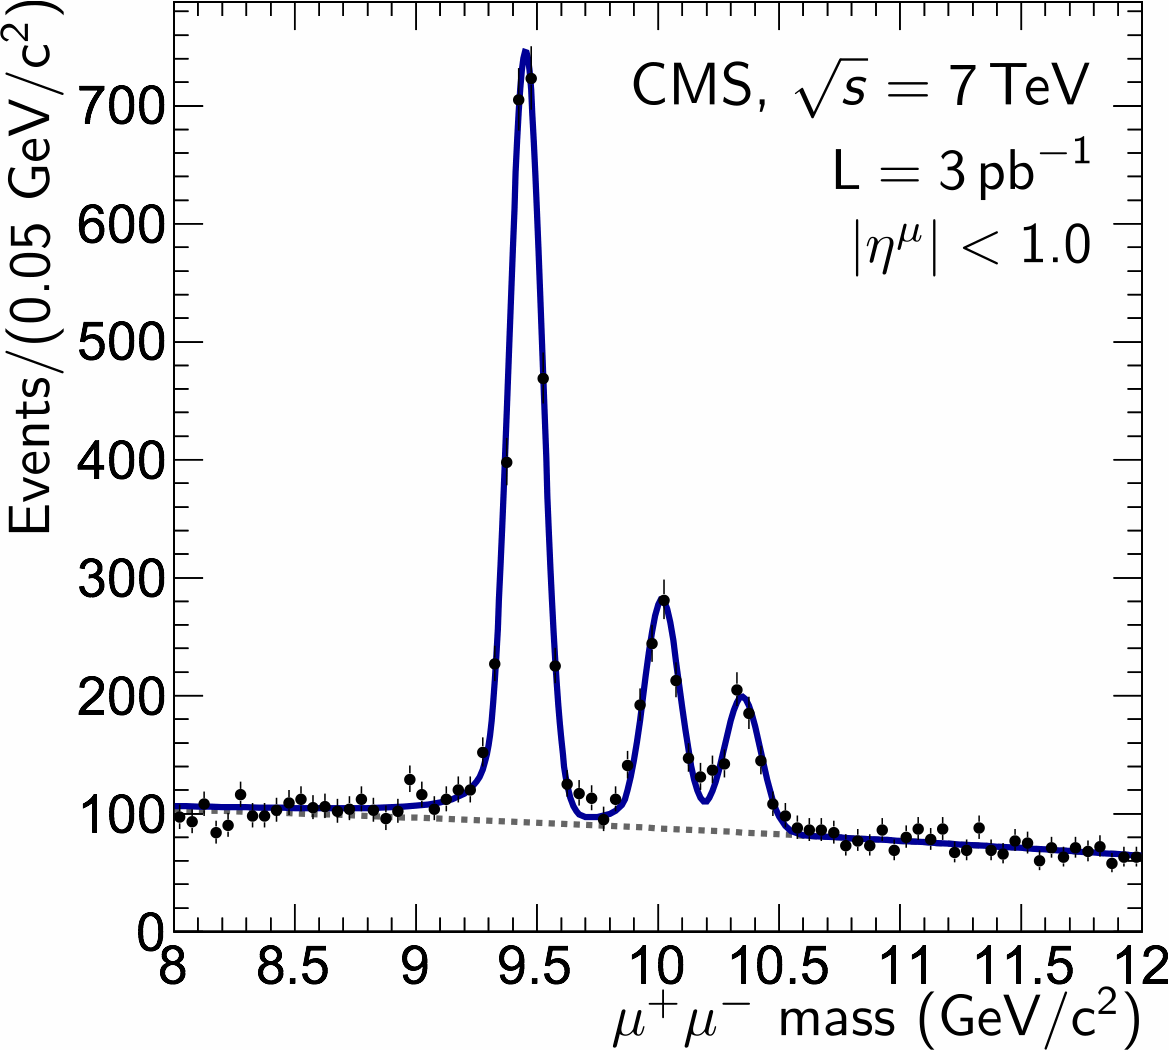
The Υ signal yields are extracted via an unbinned maximum likelihood fitiii to the di-muon mass distribution, in the range 8-14 GeV/c2. The mass resolutioniv achieved by CMS (about 69 MeV/c2 in the central rapidity region, and 96 MeV/c2 averaged over all rapidities) allows it to distinguish all three states – 1S, 2S, and 3S – which are fit simultaneously. The analysis was performed on 3/40 of the 2010 data. We observe about 12,000 Υ particles. The efficiency and acceptance corrections are applied, on a per-event basis, for each upsilon decay as part of the fitting procedure.
The differential production cross-sections, as a function of transverse momentum (pT) and rapidity, for the individual signal states as well as their relative ratios, are extracted. The normalised momentum-dependent cross-sections agree well with earlier Tevatron results, while the observed total 1S state cross-section is about 3 times larger at the LHC. The 3S and 2S ratios relative to the 1S are found to increase with transverse momentum.
Complementary studies, including of the production polarisation, are being performed using the current 7 TeV pp datasets. The Υ signals are also being investigated using last year's heavy-ion run and the short pp run at 2.76 TeV earlier this year.
i Track embedding: Monte Carlo tracks are embedded into real events to test the efficiency with which the muon tracks coming from Υ decays can be reconstructed given the presence of other tracks in the event. This study marks the first time CMS has used this technique in a physics measurement.
ii Tag-and-probe analysis: The particles J/ Ψ, Υ and Z sometimes decay to two muons. If two tracks with the invariant mass equal to one of these particles are observed in the silicon tracker, and one of the tracks is identified as a muon in the muon system (a tag) the other track must be a muon too (a probe). We can measure the efficiency of the muon system by checking how often the probe has produced a signal in the muon system. Using the same approach we can also measure the trigger efficiency.
iii Unbinned maximum likelihood fit: Inserting data into bins in order to produce histograms involves the loss of information. For example, the values 1.4 and 1.7 might both be slotted in the bin 1.0-2.0. An unbinned fit is produced without putting data into bins thereby retaining more information. Maximum likelihood tells us that the fit has maximum probability of supporting the hypothesis.
iv Resolution: The width of the mass peaks. A higher resolution has a narrower, better-measured peak.
Figure caption: The di-muon invariant-mass distribution in the vicinity of the Υ(nS) resonances.
- Log in to post comments

