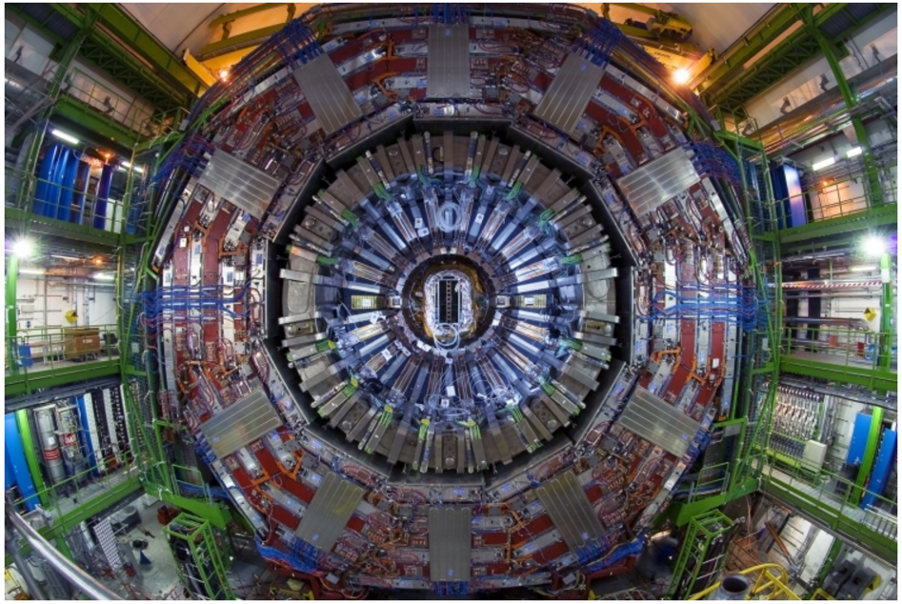
The CMS detector, illustrated in Fig. 1, is centred around the largest and highest granularity silicon tracker ever built, including around twenty thousand detector units structured in thin cylindrical layers that extend over nearly 6 metres along the beam line. The tracker is made of two kinds of detectors, pixels and microstrips, organised in a barrel section and two endcaps, following the overall design of the CMS detector. The pixel and strip silicon modules give electronic signals (“hits”) whenever their cells are crossed by the charged particles produced when the LHC beams collide. These hits are then combined with each other to reconstruct the trajectories of the particles that cross the successive layers.

Figure 1: General view of the CMS detector. The silicon tracker, composed of pixel and microstrip channels, is shown at the centre, in blue.
The silicon modules are designed to identify the passage of charged particles with an intrinsic spatial resolution better than 50 microns. However, the detectors cannot be mounted in their supports with such a good precision, so that the uncertainty on the trajectories is dominated by the mechanical misalignment of the modules themselves. To solve this problem, and fully exploit the resolution power of the silicon sensors, the whole tracker system needs to be very carefully aligned.
The alignment procedure is sketched in Fig. 2, where we see (on the left) how a fitted trajectory (solid line) would be distorted because of the misalignment of the modules with respect to the real track (dashed line) and then (on the right) how the alignment correction brings the result much closer to reality. Several CMS measurements critically depend on this correction, including lepton reconstruction and identification, reconstruction of primary vertices, and precise determination of invariant masses.

Figure 2: A real track (dashed lines) would be measured with a visible distortion (solid line in the left panel) in the absence of tracker alignment, while the aligned tracker provides a much better result (solid line in the right panel).
Up to nine parameters are used in CMS to describe the geometrical placing of the silicon sensors (typically for the position, orientation, and surface deformations). Furthermore, the parameters change over time (due to variations in temperature, magnet cycles, integrated irradiation, etc.). In total, several hundred thousand parameters must be determined to accurately describe the tracker alignment. Three different strategies are used during and after the data taking periods, leading to different levels of accuracy in the measurements, as illustrated in Fig. 3 for the measurement of the mass of the Z boson, using its decay into a pair of muons. During data taking the corrections must be derived very quickly, implying some lack of precision (blue squares). After the data taking period is over, there is more time to apply more rigorous (and time consuming) algorithms, so that improved results are obtained (red circles). By using even more refined procedures, including more frequent updates and controlling the positions of smaller structures, CMS has recently made a big step towards the ultimate tracking precision, as illustrated by the green triangles in Fig. 3: the reconstructed Z boson mass no longer depends on the difference between the angular directions of the two emitted muons.
Many challenges are still awaiting us. In the coming years, with the ever increasing amount of data recorded by CMS, we will need to improve our techniques to get the precision of the alignment obtained after reprocessing (in green in Fig. 3) on the fly. This will require not only automation but also new ideas and intense development.

Figure 3: Mass of the Z boson as reconstructed from the two muon tracks using three levels of tracker alignment. The x-axis corresponds to the difference of pseudorapidity (a variable equivalent to the angle of emission w.r.t. the longitudinal axis of the CMS detector) of the two outgoing muons.