Measuring the interaction between the Higgs boson and other particles is essential to understand if the particle behaves consistently with predictions. For the International Conference of High Energy Physics 2020, the CMS experiment has released new results measuring the interaction between the Higgs boson and the top quark.
In 2012, the ATLAS and CMS experiments at CERN discovered the long-sought Higgs boson, closing the Standard Model of Particle Physics and opening a new amazing era in particle physics. This huge success happened seventeen years after the heaviest elementary particle so far, the top quark, had been discovered by the CDF and D0 experiments at Fermilab.
The Higgs boson is a new kind of particle that has intrinsic connections to all the massive elementary particles and plays the unique role of giving them mass. Further studies of such a particle are of paramount importance in unraveling the nature of the universe. While top quarks led to a more accurate prediction of the Higgs boson mass in the first place, the exact link between the top quarks and the Higgs boson was impossible to study until very recently. Finally, such important studies are taking a shape that opens a new door in the understanding of the fascinating Higgs boson. Interestingly enough, the Higgs boson is the second heaviest particle weighing about 73% of the top quark mass. The fact that these two particles have a similar mass means that they interact very closely, which is a unique feature that only occurs between the top quark and the Higgs boson. Here we present some of the highlights from the CMS studies of a fascinating dance between top quark and the Higgs boson.
Particle properties and their relations can be studied by observing and measuring the processes in which they intervene. At the LHC top quarks can be produced together with a Higgs boson either individually (the tH process) or in pairs (the ttH process). The problem is that these reactions occur very rarely compared to many other possible outcomes of any single proton-proton interaction. This is, partly, due to the large mass of the particles involved. For example, during the last data taking at CMS spanning over three years, only 70,000 Higgs bosons were produced in association with top quarks, while more than 10 million pairs of top quarks happened. To further complicate the challenge, inside the LHC experiments hundreds of millions of interactions (proton collisions) are happening each second. As a result, picking out that one exciting collision is a significant challenge.
Neither the Higgs boson nor the top quarks exist long enough to reach the detector, and further decays (reaction chains) occur. These decay products are what is detected by the experiment. The CMS detector can only measure particles stable enough to reach the sensitive detector components. Such stable particles are electrons, muons, photons and jets, the latter being sprays of particles resulting from quarks. Since both the top quarks and the Higgs bosons are unstable, carefully measuring the decay products is very important. Top quarks decay most of the time into a bottom quark and a W boson. The W boson decays further on their own until stable particles are produced. On the other hand, Higgs bosons can decay in several ways but do it more often into heavy particles, like W and Z bosons or taus. W and Z bosons decay a fraction of the times into leptons (electrons, muons and taus), so CMS scientists have carefully studied collisions in which several of these particles have been produced.

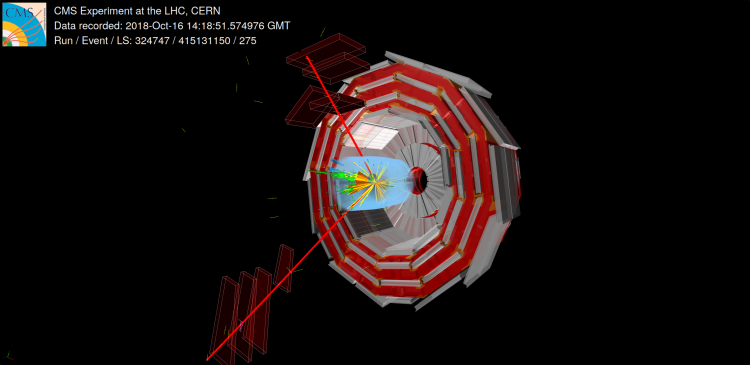
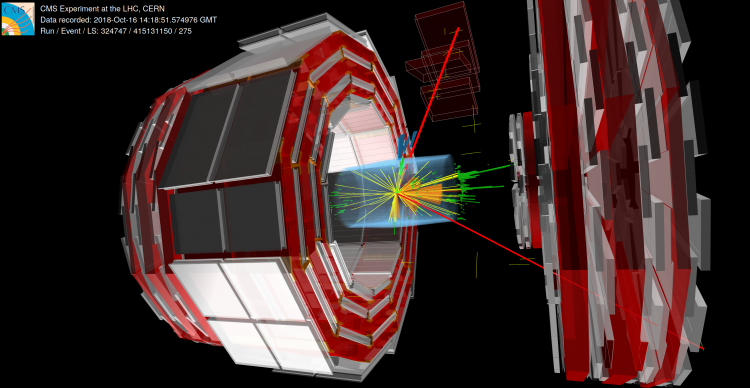
Figure 1: A graphical display of an event collected by the CMS detector depicting a possible production of a Higgs boson in association with a pair of top quarks. This event could be explained if the Higgs boson decayed into a pair of W bosons. Two other W bosons and a couple of b quarks would come from the decay of the top quarks. Two of the four W bosons would decay further into a muon (red line) and a neutrino (which escapes undetected). The other would produce four more quarks. The orange cones in the picture show the jets resulting from the hadronization of the quarks.
CMS scientists measure final decay products, such as jets, electrons, muons and tau leptons, in each collision. Figure 1 shows an event selected as a ttH candidate since it includes all the expected objects resulting from the process. Since other events can give similar topologies, it is very complicated to find out whether this particular event corresponds indeed to ttH production. Therefore, advanced data analysis techniques such as neural networks are used to identify which collisions contain these particles. These techniques are similar to facial recognition methods used, for example, in social platforms. Interactions tend to have typical “faces” that scientists call signatures and allow to classify them with the use of neural networks. With them, it is possible to give a resemblance score to every single interaction. Such scores can then be put into a combined graph that helps scientists to get an overview. An example combined graph is shown in Figure 2: three signatures (“faces”) can be seen there, namely ttH, tH, and the rest (background). The black dots represent the measured data, while the columns correspond to the best estimate based on the theoretical predictions, which are collectively known as the standard model. Note that the predictions include red (ttH) and blue (tH) interactions that, together with all the other interactions (background) very closely match the measurement.
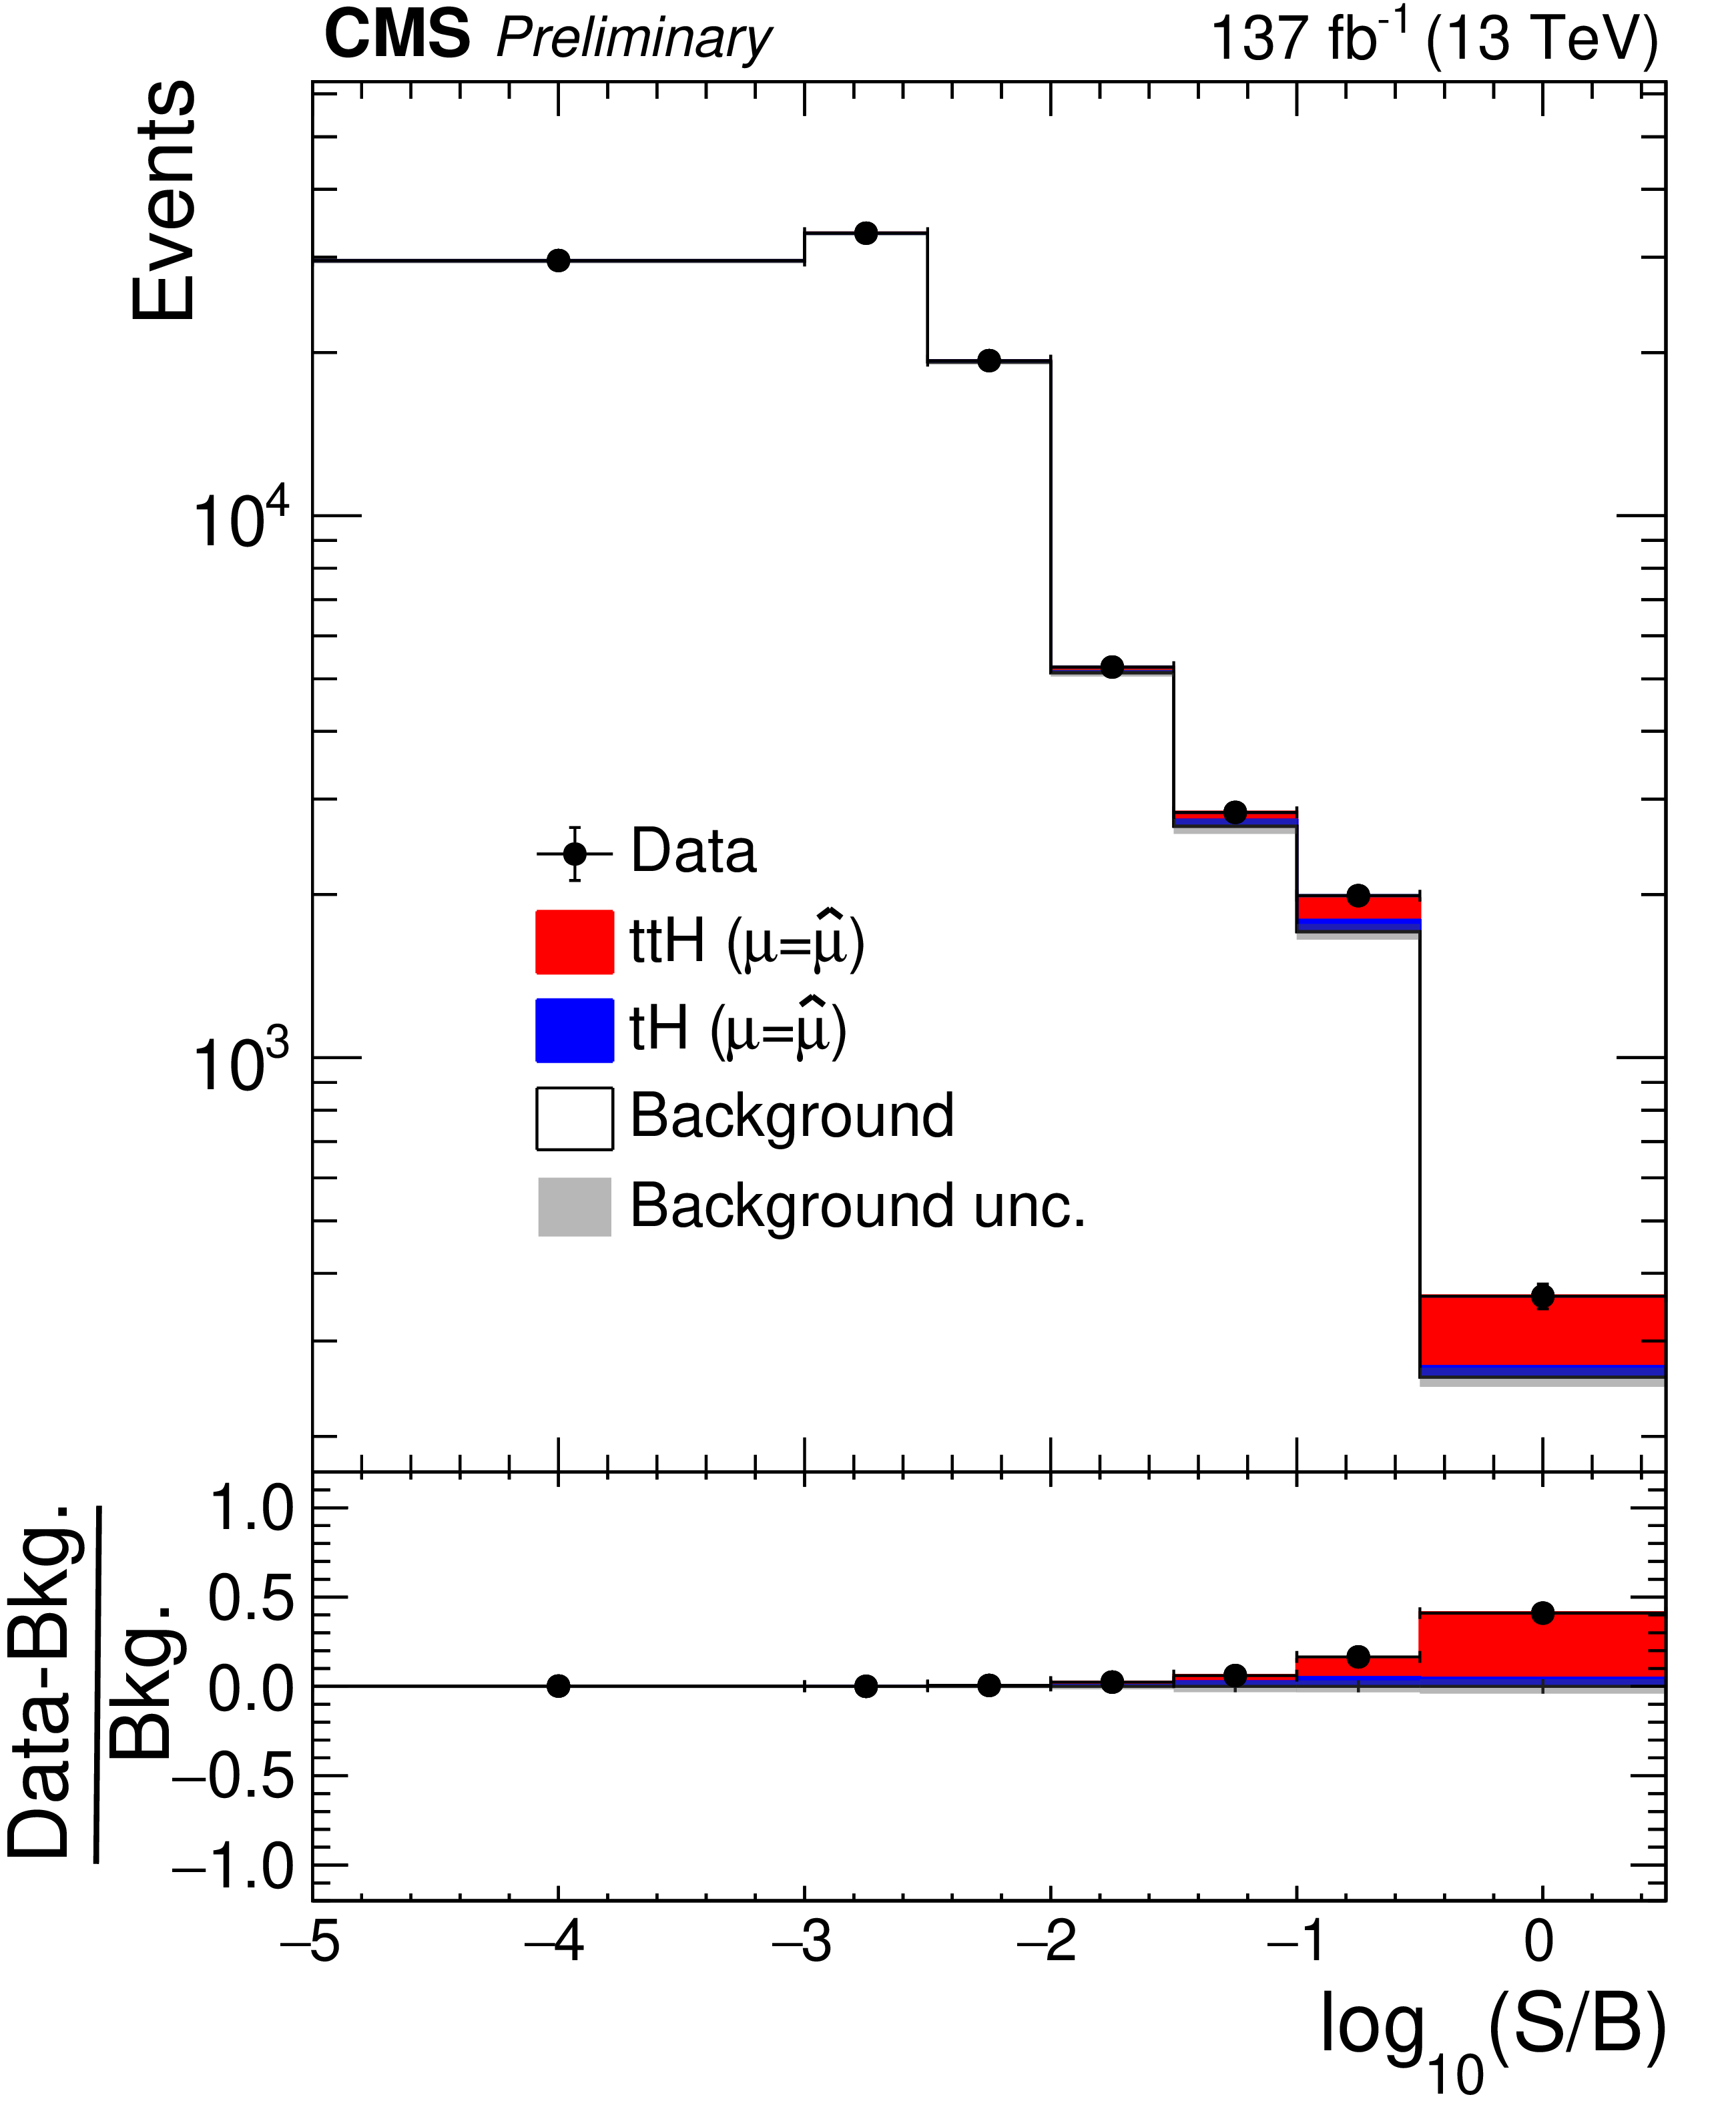
Figure 2: Collision events are classified depending on how close they look like signal (ttH or tH) or background events (other processes). This figure shows the result of this classification, displaying the number of collision events (vertical axis) as a function of the probability of an event being ttH or tH (horizontal axis). The lower the number in the horizontal axis, the lower the probability of the event to come from ttH or tH. The black dots show the data recorded by the experiment, while the bars in different colours show the theoretical prediction for each process. The contribution from ttH events is shown in red, the contribution from tH processes in blue, and in white the rest of processes that can occur in the Standard Model.
Scientists quantify potential observations of new processes by evaluating the probability that the results obtained can be due to a statistical fluctuation under the assumption that those processes do not occur. The probability of the observed results to be due only to processes different from ttH is smaller than 1 in half a million. Such a probability is very close to the usual “5-sigma” observation threshold. Also, the measured number of such interactions is in close agreement with the prediction when ttH and tH are included. This precise measurement of the number of ttH and tH interactions marks the start of an era of top and Higgs precision measurements.
Furthermore, the current data can be used to study two specific Higgs boson properties: κt and κV. These observables are defined respectively as the ratio between the measured and theoretical coupling of the Higgs boson to top quarks and vector bosons (W and Z). If the Standard Model holds true, these values should both be equal to 1. Figure 3 shows the results achieved by CMS in the measurement of κt and κV. The various lines in the graph correspond to values of κt and κV that are consistent with the data. As it can be seen the results are compatible with the standard model within the still large uncertainties. We expect to narrow the uncertainties as more data arrives from future LHC runs.
These new studies are only the first try to disentangle tH and ttH, and there are many more rocks to be turned, i.e., many more properties to be measured. The upcoming LHC collision data will grant new possibilities and ways to study the unique particles, such as the Higgs boson and its properties, that will unravel further mysteries of the Universe.

Figure 3: Results from the measurement of the Higgs boson-top quark interaction (κt, horizontal axis) and the Higgs boson-W boson interaction (κV, vertical axis). Measured values of κt and κV equal to 1 would mean that the three particles interact as expected in the Standard Model, while larger values mean stronger interactions and smaller values weaker interactions. The full and dashed lines are the result of this measurement by CMS. These lines are drawn in a way that if the experiment would be repeated many times, the actual value of the coupling would be contained within the lines a 68% and 95% of the times, respectively.