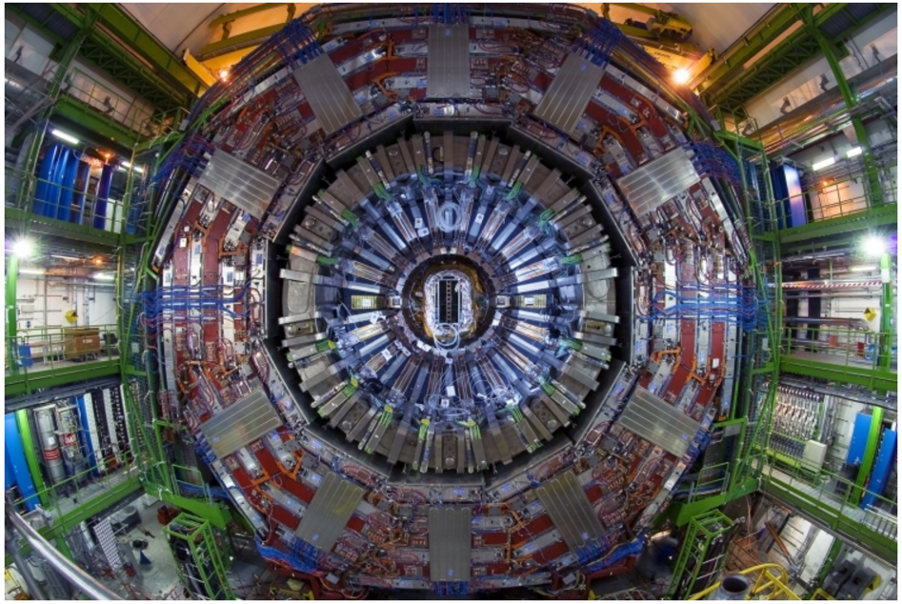
, the electron track (green) and a b-tagged jet (cluster of tracks in orange cone)")
The CMS collaboration has examined for the first time the kinematic dependence of the production of a top quark and a W boson. This gives insight into the quantum interference of top quark production at the LHC and allows more accurate background predictions for searches for new particles.
Particle physics research often involves the analysis of accelerator data where physicists look for tiny differences from the predictions of the theoretical framework describing the interactions of elementary particles (the Standard Model). These expectations are usually extracted from simulations that use the latest available theoretical knowledge of the proton-proton collisions of the LHC.
Using simulation comes at a price: the assumptions used in the simulation must be taken into account, and that sometimes results in substantial uncertainties on the prediction. With the LHC data, it is possible to experimentally check the assumptions on individual Standard Model production modes, usually with lower uncertainties than the theoretical predictions. That knowledge can then be used to improve the simulation, and that way increase the sensitivity to search for deviations from the Standard Model.
An important background when searching for many signatures of new particles is the production of top quarks. The top quark is the heaviest among the different elementary particles in the Standard Model. The top quark and the W boson are a dynamic duo: in almost all cases the top quark decays into a W boson (plus a bottom quark). But it is also possible that the collisions at the LHC produce a top quark together with a W boson: this process is called the tW channel and occurs about 12 times less often than the most common way to produce top quarks (in pairs).
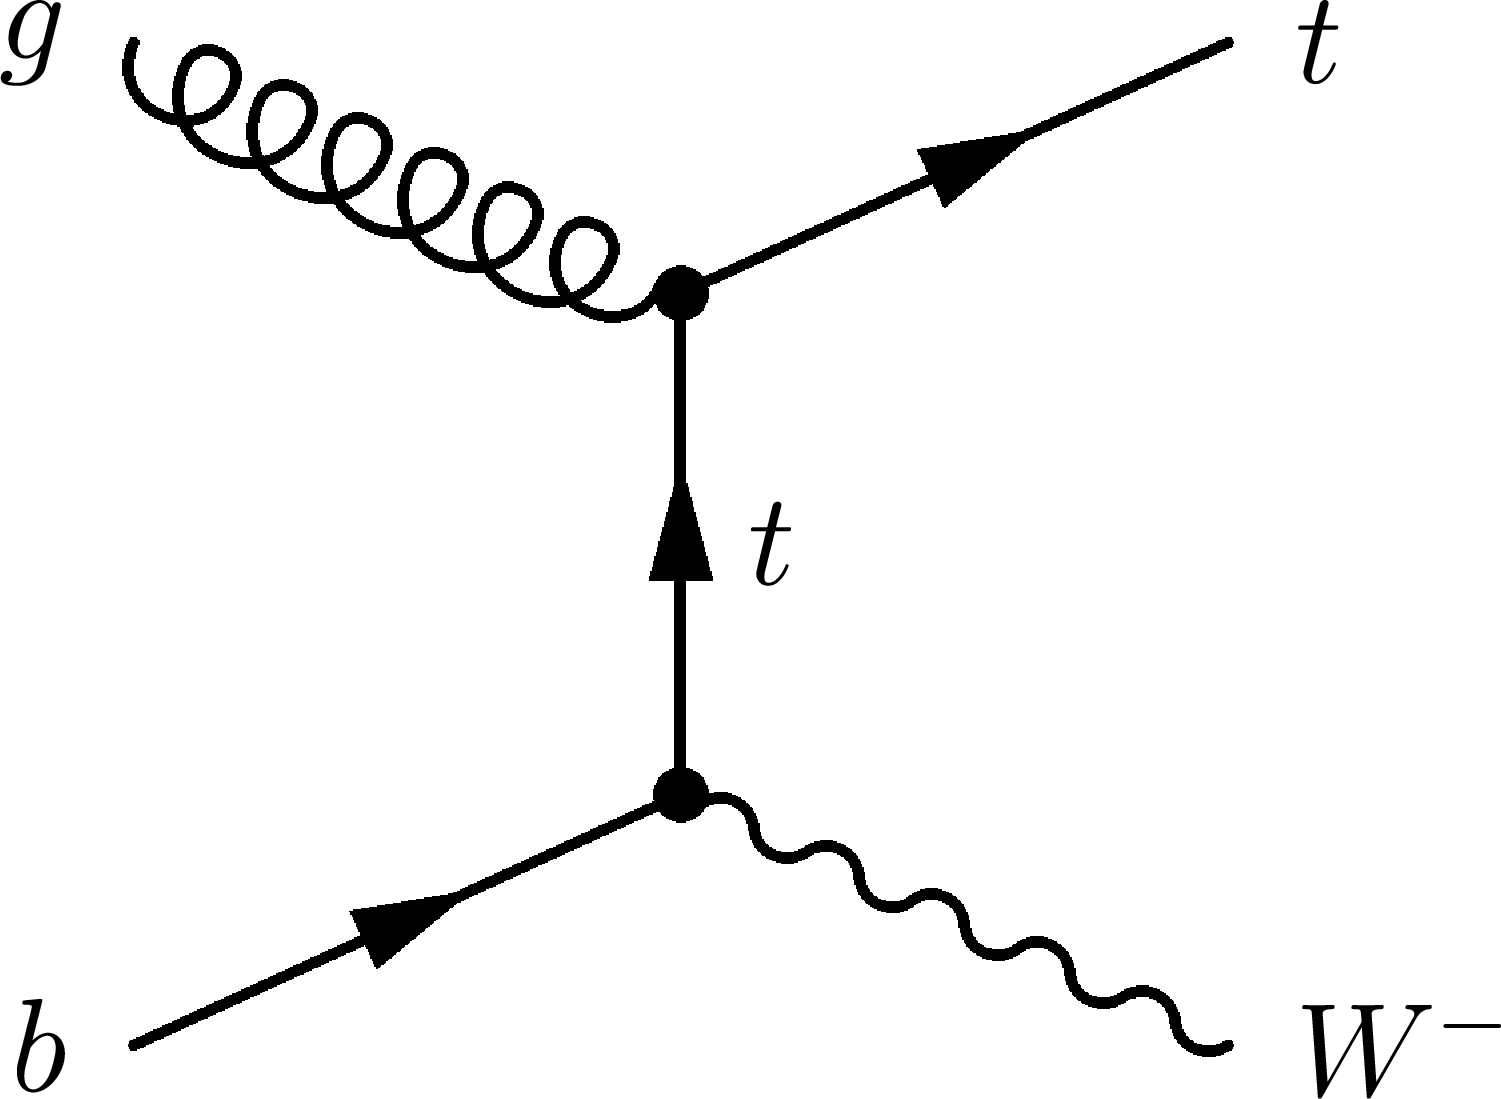 Figure 1: Feynman diagram, a graphical representation of particle collisions. The colliding gluon and b quark can create a top quark and a W boson. This diagram is one of many possible production modes but represents the simplest, leading-order, production of a top quark in association with a W boson.
Figure 1 shows the simplest way to produce a top quark and W boson. Such a diagram is called a Feynman diagram, and this one represents the leading order process: the gluon and b quark (on the left) collide and eventually create (on the right) a top quark and a W boson. The diagram is considered of leading order because of the minimal number of intermediate interactions between particles. Feynman diagrams allow particle physicists to predict the different mechanisms that can produce particles, but they also represent a graphical way to represent the physics calculations done with the Standard Model.
If one extra intermediate particle is added to the diagram (then called next-to-leading order), a similarity appears between top quark pair production and the tW channel. In essence, they can end up creating the same particles in exactly the same way (a top quark, a W boson and a bottom quark). This happens only in a fraction of diagrams, but this means that at next-to-leading order, top quark pair and tW production cannot be just treated as separate processes.
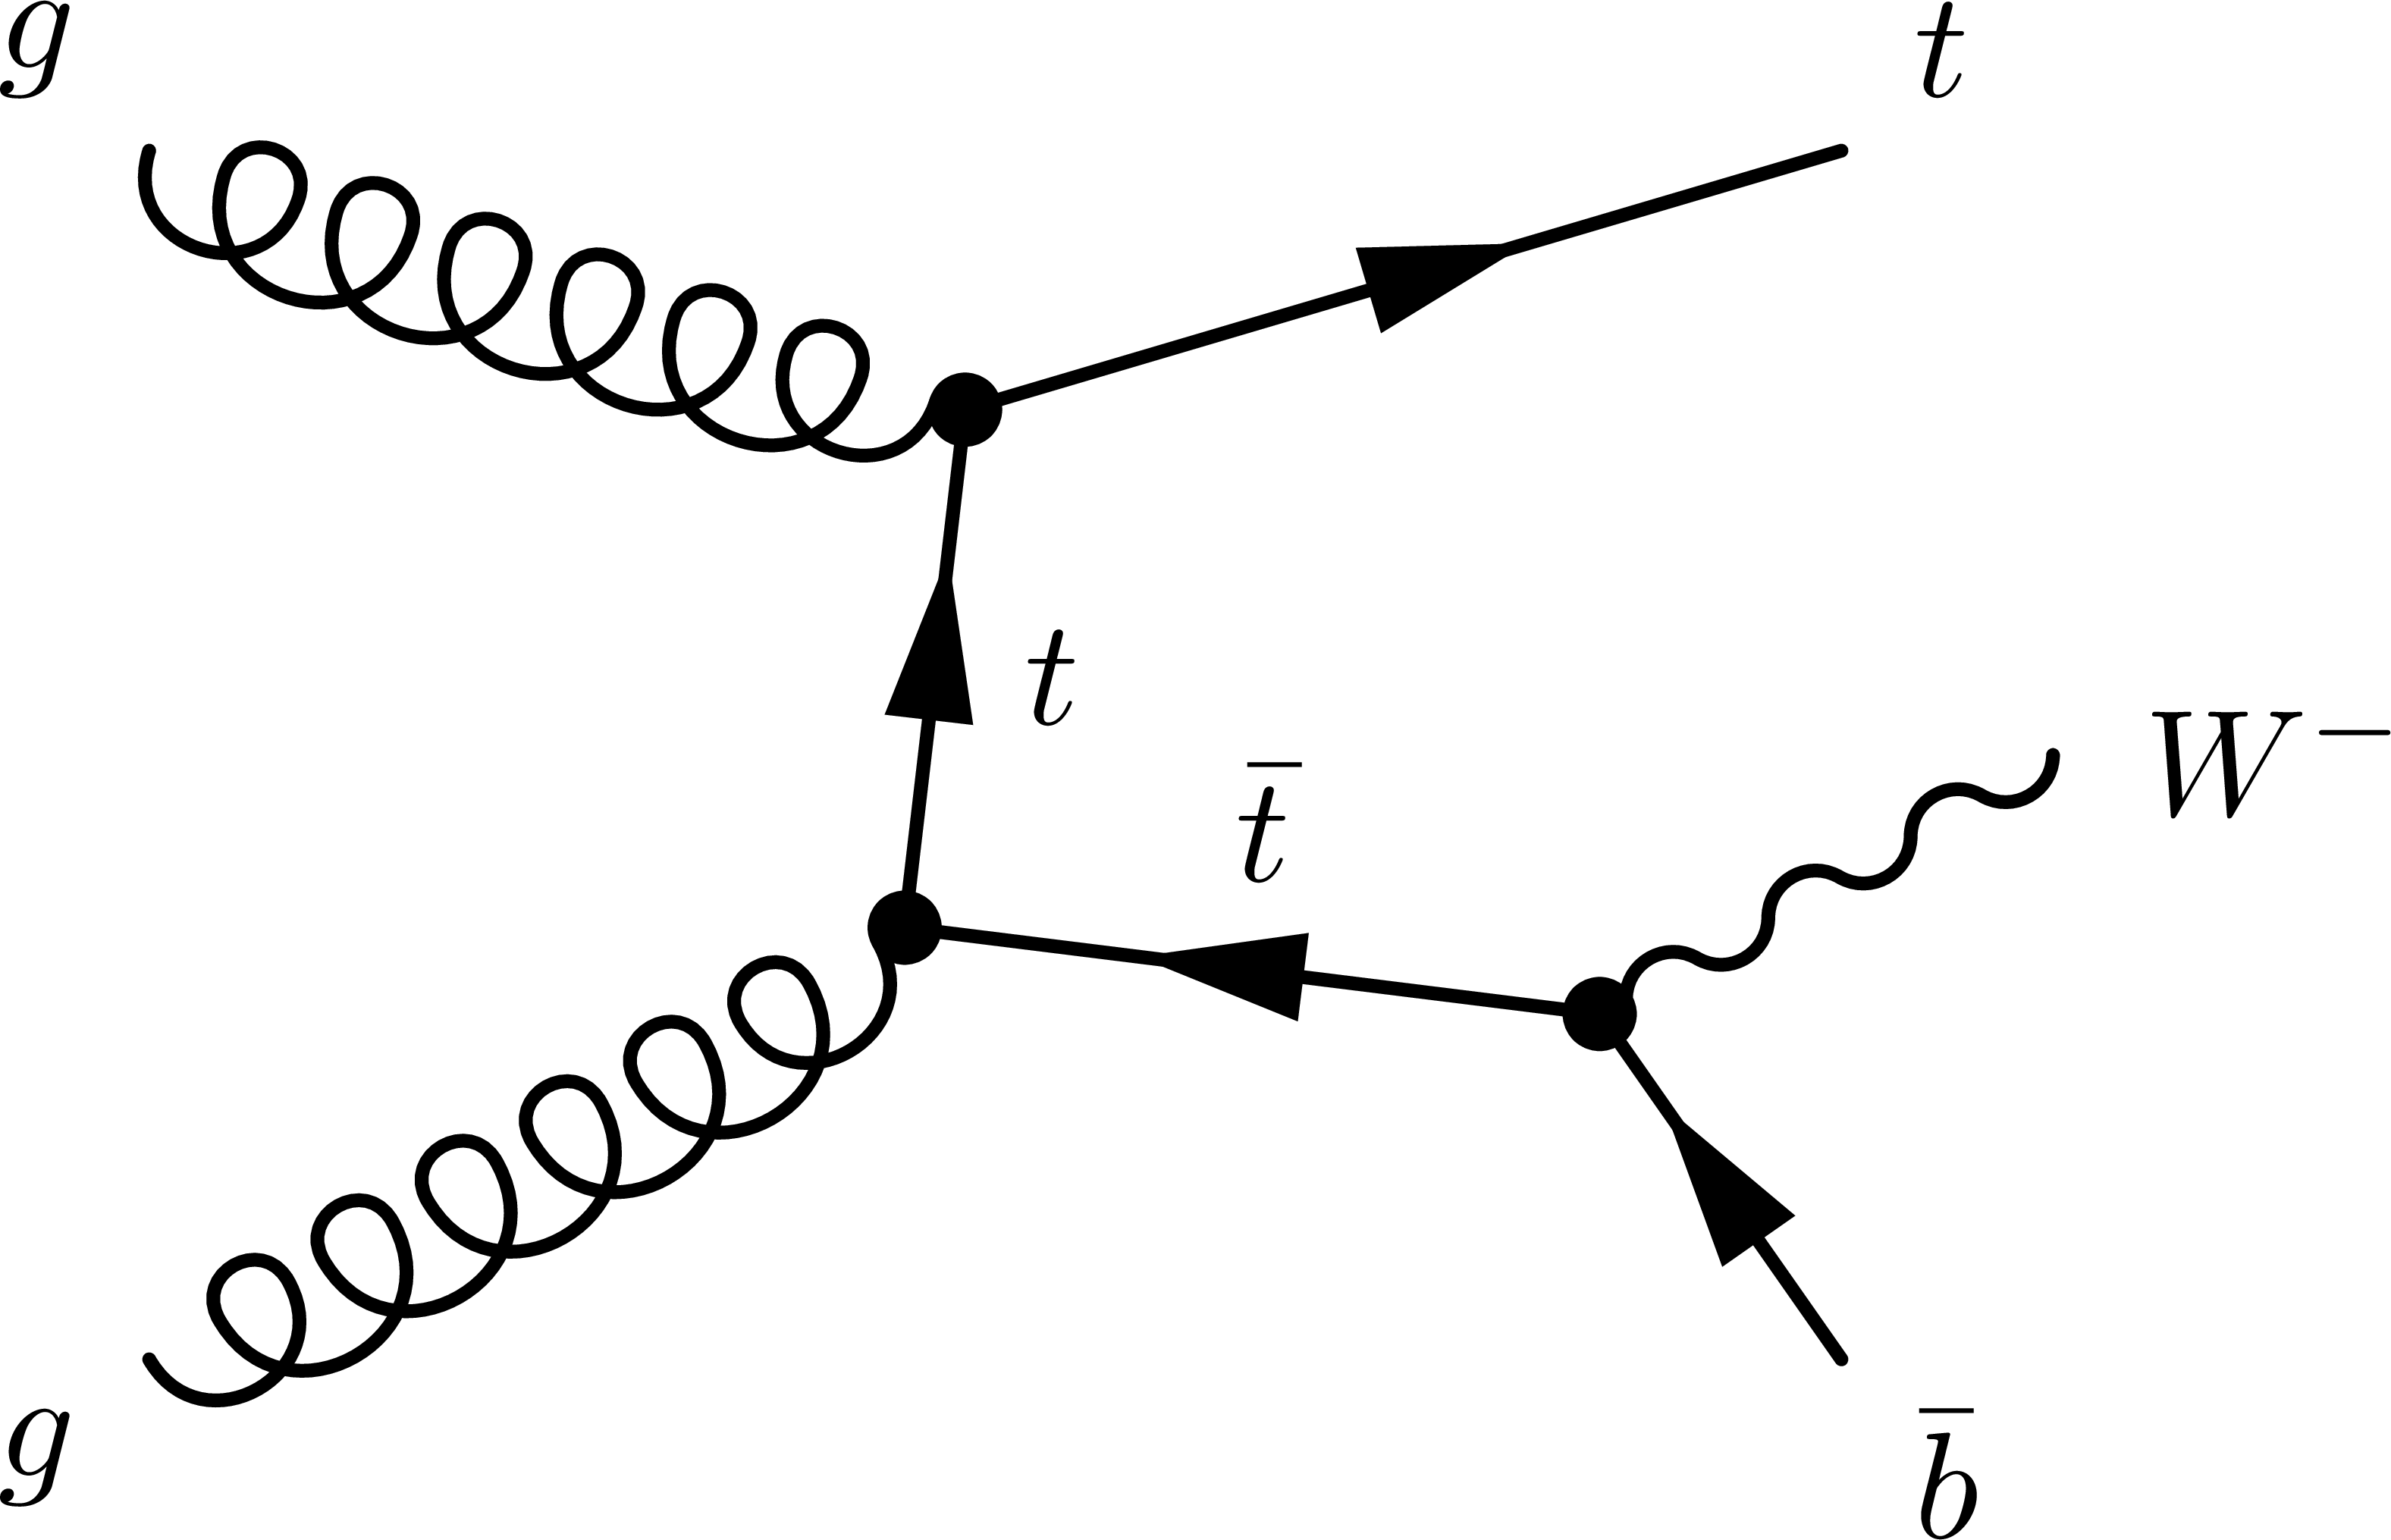 Figure 2: Example Feynman diagram of top quark-antiquark pair production that can create a top quark, a bottom quark and a W boson. This diagram is one of many possible production modes but represents one example of next-to-leading order production of a top quark in association with a W boson.
The fact that tW and top quark pair production cannot be disambiguated at next-to-leading order has consequences. First, a prediction will give the exact correct answer only when all possible particle diagrams are considered. And second, if both top quark pair production and tW production are simulated independent from each other, the same diagrams might be used twice, resulting in double-counting.
It is natural to wonder why the combined collection of diagrams is not just calculated, taking into consideration all the interferences. Unfortunately, it still is exceptionally challenging to do that calculation and to put that in the simulation. Only recently a subset of the complicated Feynman diagrams has been calculated so including the complete picture in the simulation is still far away. At the moment, the only solution is to correct for this double-counting, and there are two common ways to achieve that, the diagram removal (DR) and diagram subtraction (DS) methods.
One way to measure the tW process in more detail is the measurement of the dependence of the production rate on different features of the final state particles of the events. In particle physics, such a measurement is called a differential cross-section. For example, one can show the cross section as a function of the energy of one particle or depending on geometrical properties such as the difference in angle between two particles. The CMS Collaboration recently released a new differential cross-section analysis that uses the data recorded with the CMS detector in the year 2016. The data is filtered such that the presence of the tW process against all other processes is enhanced, keeping only those events that have one electron and one muon, and one jet identified as coming from a b quark. That way the selection isolates mostly tW channel events, where the W boson decays to either the electron or the muon (and their neutrino), and where the top quark decays to a bottom quark and to another W boson that also decays leptonically to the other lepton.
But there is still background left after that first selection, and mainly from the very similar top quark pair production process. To calculate the differential cross section, the amount of signal in each bin is estimated by doing a background subtraction. Any impact of detector effects is corrected for, this procedure is called unfolding. After unfolding the final results can be directly compared to theoretical calculations, making it possible to investigate any differences between the DR and DS scheme in comparison to the data. Figure 3 shows that there is a fair agreement within the uncertainties, and the difference between the DR and DS methods is tiny compared to the total uncertainty. The experimental uncertainties still have a relatively large effect and are related to the modelling of the jet energy. Another influence comes from uncertainties related to the modelling of the background, but that means this measurement will improve when more data is added in the future.
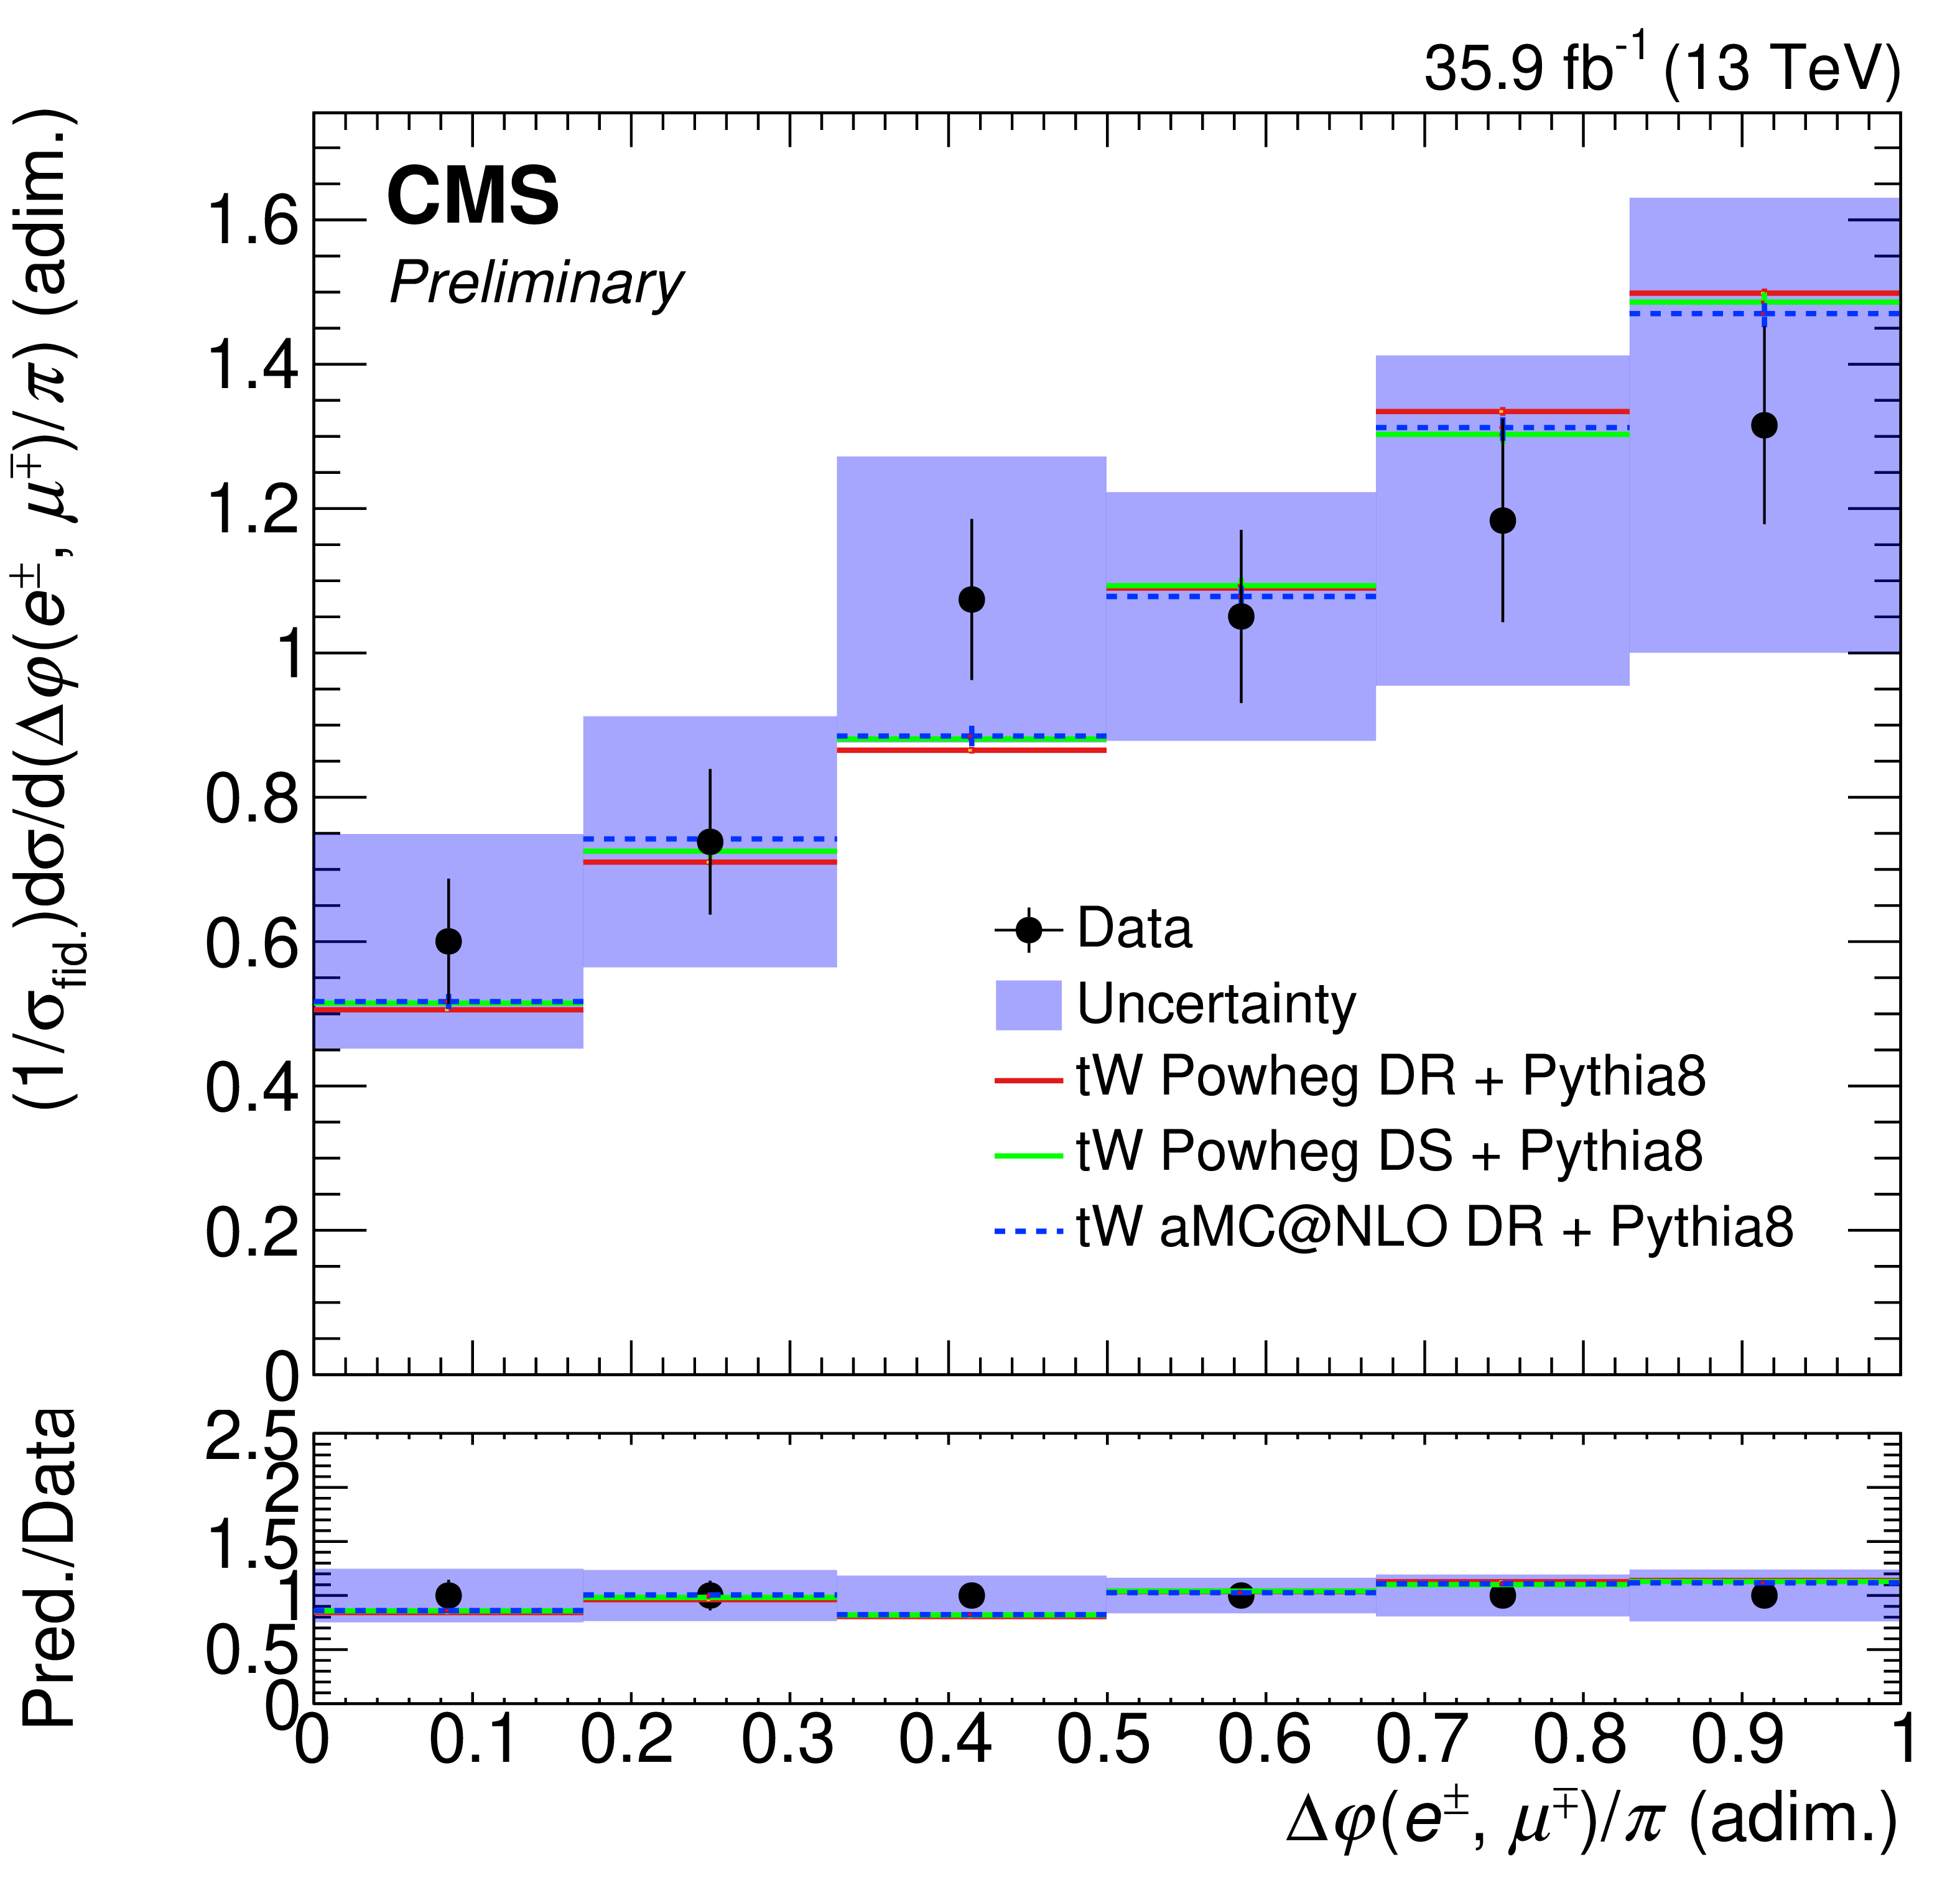 Figure 3: Normalised differential cross section of the tW process as a function of the angle between the electron and the muon in the transverse plane.
The CMS Experiment has also collected data in 2017 and 2018, and including those extra years would mean about four times more data compared to only examining the data collected in 2016 as is done in this analysis. Furthermore, the total amount of collected data by the CMS experiment to this day is still less than 5% of the amount of data that is expected during the LHC’s lifetime, so this first measurement will still improve a lot over time. On the theory-side, more advanced simulation is also becoming available for the combined top quark pair and tW production processes. Knowledge of tW production will eventually reduce the uncertainty associated with simulating important backgrounds like this process. Measuring the tW cross section differentially is an important first step, and analyses with more data are expected to deepen the understanding of the interference between top quark pair production and tW production.
Read more about these results:
- Log in to post comments