CMS presents the most precise measurement of WWZ production to date by combining Run 2 data with more recent Run 3 data.
The electroweak interaction provides a unified description of the electromagnetic and weak forces, but this symmetry is broken by a mechanism related to the Higgs boson, observed by the ATLAS and CMS Collaborations in 2012. As a result, the mediator of the electromagnetic force (the photon) is massless, while the mediators of the weak force (the Z, W+, and W- bosons) are massive. Despite the triumphant success of the Standard Model (SM), we know it cannot be the full story, as there are many questions about Nature that are not answered. Among the goals of the experiments at the LHC is to search for hints of new physics by probing the details of electroweak interactions.
The SM predicts extraordinarily rare interactions involving the heavy electroweak bosons and the Higgs boson. Only about one out of every 200 billion proton-proton collisions at the LHC produces the three massive electroweak bosons together (known as “WWZ production”). This rate includes the direct production of the three particles together, as well as a production mode that includes an intermediate Higgs boson, as shown in Fig. 1. If new physics is hiding in the electroweak sector, these types of extremely rare interactions among W, Z, and Higgs bosons are an exciting place to stage the search!

Figure 1: Schematic depiction of the WWZ production process. On the left, the three bosons are produced directly, while on the right, the pair of W bosons are produced from the decay of a Higgs boson.
To chase after these elusive processes, the CMS experiment must make use of as much data as possible. This includes data collected during “Run 2” (2016-2018), in addition to data collected during the ongoing “Run 3” (2022-2023). The center-of-mass energy for the proton-proton collisions during Run 3 is 13.6 TeV, the highest ever achieved by a particle collider.
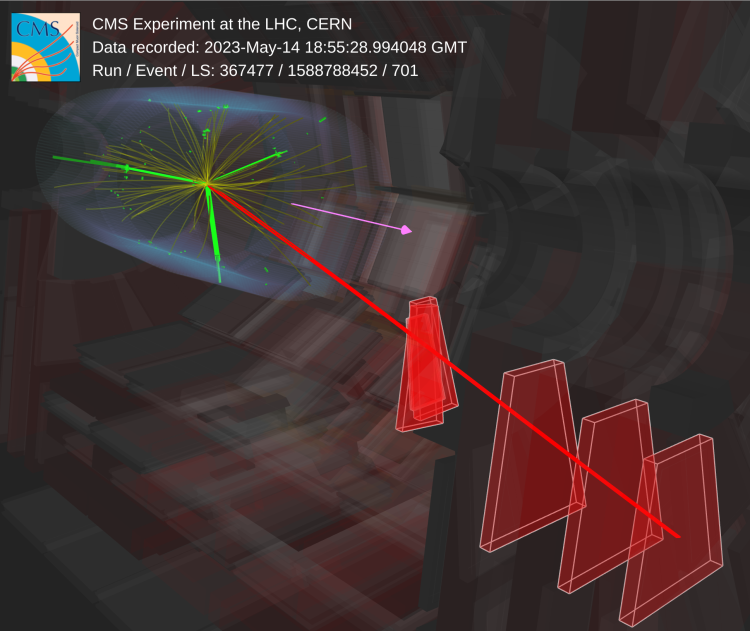
The presence of the signal can only be established after we account for background processes predicted by the SM. Background processes lead to signatures in our detector that look nearly identical to the signatures left by the WWZ signal process. In order to reveal the rare signal events from the vastly more abundant background, we select collision events with very unique features, e.g. events with four charged leptons (electrons or muons). An event with four leptons consistent with the WWZ production signature, is shown at the top.
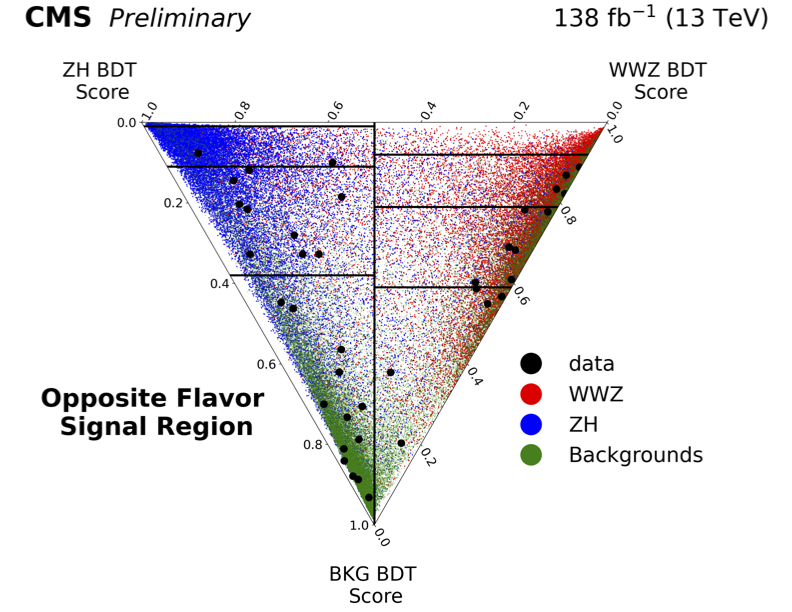
We use a machine learning technique called a boosted decision tree (BDT) to further separate our signal from the remaining backgrounds. The BDT is trained on simulated data to learn to distinguish WWZ collision events from background events. The BDT is also trained to distinguish between the two different types of signal processes (as shown in Fig. 2), which is crucial since they may be impacted differently by potential new physics in the electroweak sector. This analysis represents the first time these two individual processes have been studied simultaneously.

Figure 2: Ternary plot showing how the BDT achieves separation between signals and backgrounds. The location of each point on the ternary plot is determined by the output scores of the BDT (which indicate how background-like, how WWZ-like, and how ZH-like each event is evaluated to be). The green points indicate simulated background processes, the blue points correspond to simulated WWZ production with an intermediate Higgs boson (i.e., ZH), and the red points indicate simulated WWZ production without an intermediate Higgs boson. The black points correspond to real data events.
We can then compare the observed number of collision events in each category against the predicted number of collision events in that category (based on simulations). Accounting for the predicted backgrounds and for relevant uncertainties, we can compare the measured rate for the WWZ production processes against the SM prediction. This ratio is known as the signal strength (sometimes referred to as μ), and is equal to 1 in the case of perfect agreement with the SM prediction.
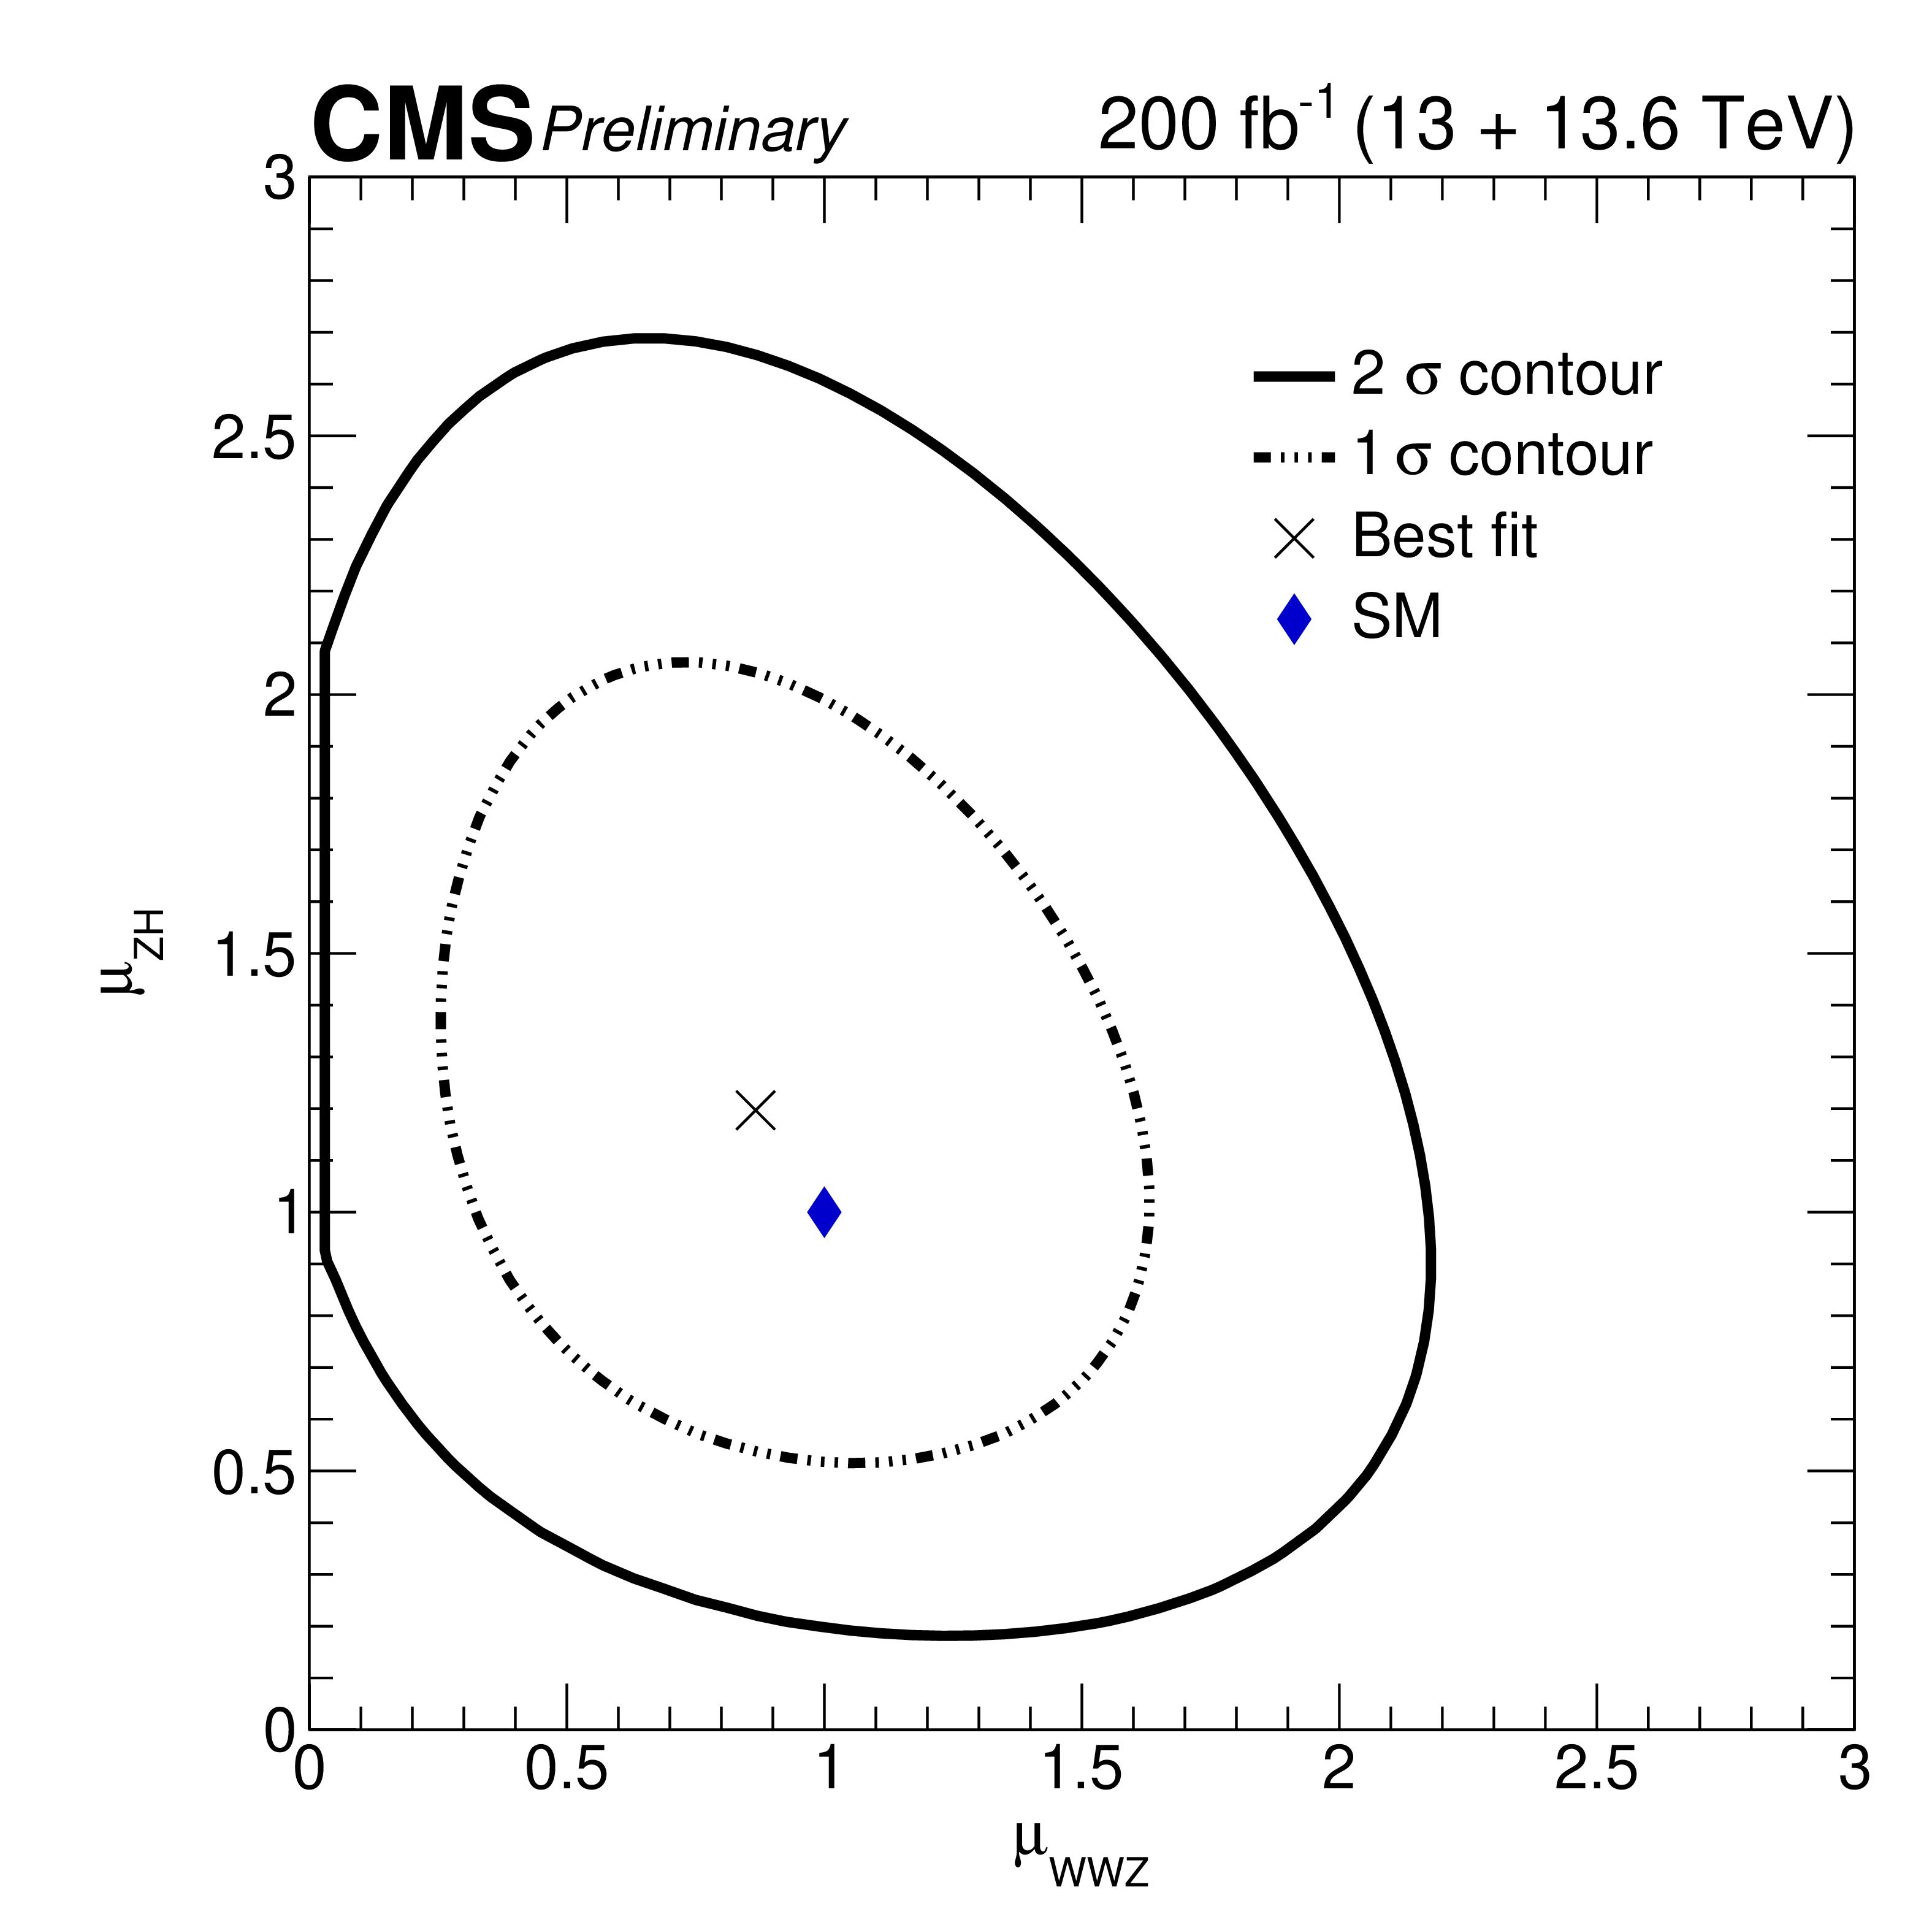
For the combined WWZ production processes (i.e., both processes shown in Fig. 1), we measure the signal strength to be 1.03 with an uncertainty of about 30%. This result is consistent with the SM, and it corresponds to the most precise measurement of the WWZ process to date. The analysis also studies the two different WWZ production modes independently and simultaneously, and the resulting two-dimensional measured signal strength contours are shown in Fig. 3. The analysis also studies the Run 2 and Run 3 periods separately; for the Run 3 period alone, the observed statistical significance for WWZ is 3.8 standard deviations, representing the first evidence for a tri-boson production process at the 13.6 TeV energy range.

Figure 3: Two-dimensional plot showing how the measured signal strengths of the two different WWZ production modes (μWWZ and μZH) are correlated with each other and how they compare with the SM prediction.
Even with the Run 2 and Run 3 (2022-2023) data together, the results of the analysis are still limited mainly by statistical uncertainty. Looking ahead, the remainder of the Run 3 period and the subsequent runs during the High-Luminosity LHC era will provide substantially more data with which to probe these rare processes in even more detail, potentially helping to illuminate the nature of physics beyond the SM.
Written by: Kelci Ann Mohrman, for the CMS Collaboration
Edited by: Andrés G. Delannoy
Read more about these results:
-
CMS Physics Analysis Summary (SMP-24-015): "Measurement of WWZ and ZH cross sections at √s = 13 and 13.6 TeV in the four-lepton channel with the CMS detector"
-
Display of collision events: CERN CDS
-
@CMSExperiment on social media: Bluesky - Facebook - Twitter - Instagram - LinkedIn - TikTok - YouTube

