 that will be in use starting LHC Run 3.")
In the LHC, groups of 100 billion protons collide 25 million times every second. But most of these protons miss, so each time we point the protons at each other doesn't give us 100 million proton-proton collisions. In fact, collisions are much, much fewer—something like only 5 to 50 collisions. The reason is that protons are tiny, and therefore there is a lot of space between them. Unfortunately, we don't have a small enough camera to show us exactly how many collisions there are in each passing. This is why physicists have developed new methods that give spectacular precision in the counting of such collisions.
It is essential to know how often the LHC actually collides to use theoretical calculations to understand how often particles, for example, the Higgs boson, are created in the collisions. That's where measurements of "luminosity" come in. Luminosity is how physicists describe how often collisions occur, and accurately measuring luminosity involves knowing how the protons are being collided.
Let’s give groups of protons the friendly name of a "bunch". And just like for many other comparable groups in life, every bunch is slightly different. When the bunches of protons cross, there is the chance that some protons collide. How bright or luminous are these bunch crossings? We aren't using light, but physicists like analogies too, so we call the number of collisions luminosity.
Figure 1: Schematic of two LHC bunches, in green and blue, respectively, approaching and colliding with each other. We need to infer with certainty the height and width of the integrated collision area in red.
In figure 1, we show what happens when two bunches meet. We can count the number of collisions after each crossing of the bunches. There are a lot of "counters'' in the CMS detector. All these counters, also indicated in figure 2, measure particles produced by collisions that are more-or-less proportional to the number of collisions. We count those (usually over a whole year) and infer how much data we collected in that time, the integrated luminosity we collected over a year, in this example.
Sounds easy, right? Not so fast…
Let's say that every time a particle passed through a detector, we counted it. For some bunch crossings, we count 5 while for others 50. To muddy the waters even more, some types of collisions produce more particles than others. So we accept that for any given bunch crossing, it is difficult (maybe impossible) to say how many collisions really occurred. However, if we study enough crossings, the average number of particles is amazingly proportional to the average number of collisions. Luckily this average is perfect for us, and we can measure the average in seconds and not hours so that we can notice any sudden changes in luminosity!
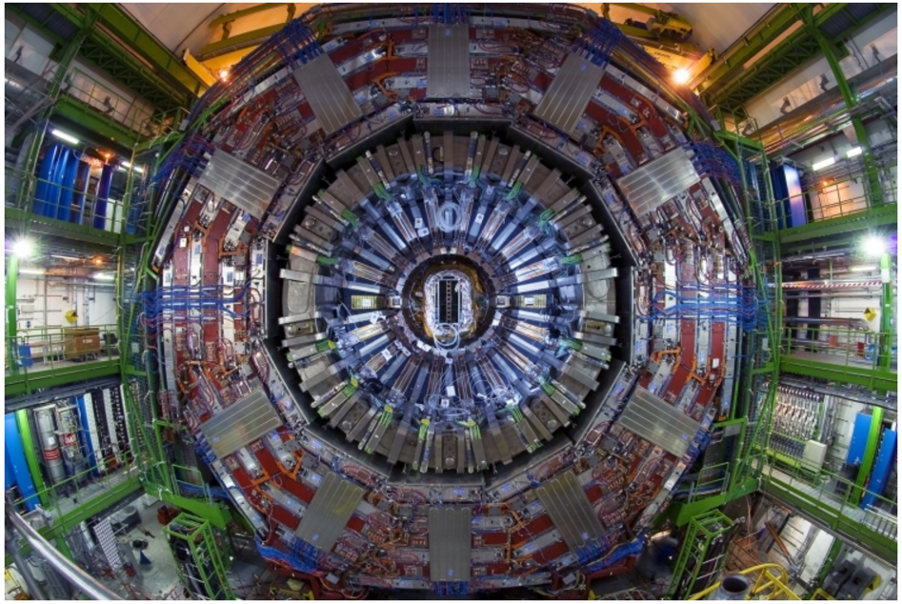
Figure 2: Schematic view of the CMS detector with arrows pointing to the location of the luminometers. The different luminometers are: the silicon pixel subdetector (in two, barrel and endcap, regions), Pixel Luminosity Telescope (PLT), Fast Beam Conditions Monitor (BCM1F), drift tubes (DTs), and forward hadron calorimeter (HF). Directly behind HF, two additional monitors (RAMSES) are also used but not shown.
So we have all of our counters for a whole year... but how bright have been the beams that we collided? To figure that out, we implement a careful displacement of the proton bunches from their normal position while recording our counter values. This method is called a Van der Meer scan (named after the Nobel prize winner Simon van der Meer). It is used to determine the luminosity simply by using how many collisions are still occurring when the beams are not perfectly pointing at each other (Figure 3). This method makes it possible to measure the size of the beam and how dense the protons are packed in the bunches. With that in hand, we can check the size of our counters and determine the number of collisions.
Figure 3: When LHC bunches gradually approach each other, they produce a beam-separation dependent event rate, whose maximum sits at 0. We measure luminosity via the size of the bunches (here shown in the vertical direction). The curves correspond to a parametrization (“fit) and its subcomponents (“Gauss 1/2” and “Const”), and the bottom panels show the level of agreement between the data and fit.
Several effects can affect the luminosity determination, with typical magnitudes of 0.1–0.5%. One example is the fact that the van der Meer method requires accurate knowledge of the bunches, simultaneously in the horizontal and vertical directions. Luminometers are sensitive to underlying data-taking conditions, some a bit less while others a bit more, due to either their intrinsic limitations or the nature of the counters. After all, the experimental world is not ideal!.
Figure 4: Examples of shorter van-der-Meer-like scans (here, the data-taking subperiods are denoted by an incremental number from 7427 to 7490) at the CMS experiment.
Both effects can be corrected, for example, with short van-der-Meer-like scans that are regularly performed throughout the data-taking periods at CMS (Figure 4). The final step is to monitor how stable over time the absolute calibration is for all the luminometers. For example, we can compare rates from different sections/parts of the luminometer over time. For example, figure 5 shows at how the precision of the luminosity measurement by the pixel tracker changes over time.
Figure 5: Example of the excellent stability of the silicon pixel tracker (here shown with four of its subcomponents)
Using this three-step approach, entirely based on data, we obtained the uncertainty of 1.2% in the luminosity estimate of proton-proton collisions in 2016, an almost record-breaking precision. This represents a factor of two improvement relative to what we had initially estimated. Taking into account correlations among the years 2015−2018 (“Run 2”), we also improved by about 15% on our preliminary estimate for the proton-proton luminosity at 13 TeV. The entire Run 2 data sample corresponds to a cumulative (“integrated”) luminosity of 140/fb with a total uncertainty of 1.6%. In the future, we expect a further improvement with our ongoing analysis for the other years of Run 2.