Even after almost 30 years since its discovery, the top quark is still offering unprecedented opportunities to improve our understanding of nature. It is the heaviest known elementary particle and its special features help us understand the fundamental aspects of particle physics. Furthermore, it provides potential pathways to unveil physics beyond the Standard Model (SM) of particle physics. While top quarks at the Large Hadron Collider (LHC) are mainly produced through the formation of top quark-antiquark pairs via the strong interaction, the study of rare production modes can give us access to complementary information that would otherwise remain unexplored. Among these, there a big interest within the particle physics community about the Z-boson-associated production of top quarks, either in pairs (the so-called “ttZ” production) or with a single top quark (denoted by “tZq” and “tWZ”). These processes give us direct access to the coupling of the top quark to the Z boson, an interaction that is believed to be particularly sensitive to new phenomena.
A simultaneous measurement of the ttZ, tZq, and tWZ channels was recently performed by the CMS collaboration and presented at the Moriond Electroweak Conference by Federica Colombina, a PhD student at DESY who is a member of the analysis team. These three processes share the same final state because they all have the decay daughters of the Z boson and of the top quark. Therefore, when measuring one of the processes individually, the other two enter in the analysis as “background”. We usually evaluate backgrounds assuming that they follow the SM predictions, but if new phenomena alter, e.g., the couplings between the top quark and the Z boson, then all three processes are affected. The simultaneous measurement of the three channels, considering all of them as “signal”, allows us to avoid having to make extra assumptions.
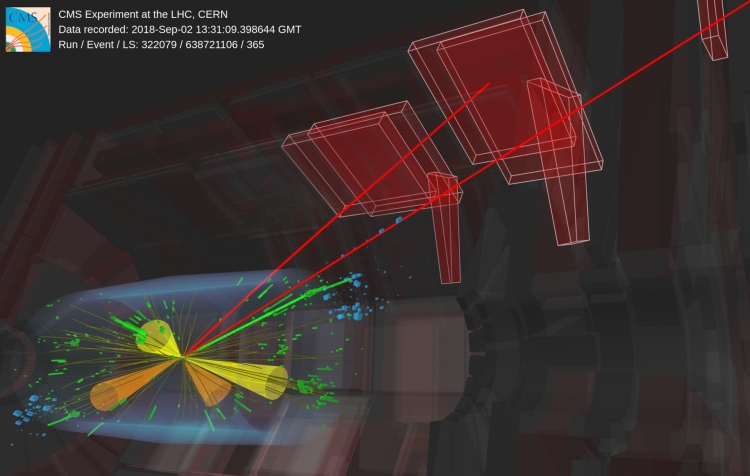
The top quark almost always decays into a W boson and a bottom quark, t → Wb, making it very challenging to distinguish between the ttZ and tWZ final states: if a bottom quark is produced along with the tWZ particles, the event will have exactly the same final state as in the ttZ case. Given this overlap between the two processes, we decided to measure their sum, rather than each of them individually. A signal-like event is displayed in Fig. 1. We target final states with three or four leptons (electrons or muons), as they lead to a cleaner signature in the detector.
Figure 1: An event recorded with the CMS detector at a center-of-mass energy of 13 TeV, compatible with the ttZ signature: two muons (red lines) arise from the decay of the Z boson, while each of the top quarks decay into a b quark, which is then reconstructed as a b jet (orange cone) and a W boson. In one case, the W boson decays hadronically leading to two light jets (yellow cones), whereas in the second case it decays into an electron (green line) and a neutrino. Try to zoom and rotate also in this separate page.
We trained a deep neural network to isolate the processes of our interest from each other and from background processes. The distributions of the output nodes are then used to fit the data and extract the signals: we measure a cross section of 1.14 ± 0.07 pb for the sum of the ttZ and tWZ channels, and 0.81 ± 0.10 pb for the tZq case. The signal extraction is performed by adjusting the different parameters in our statistical model and scanning through different possibilities until we find the point where the model describes the data best. The scan is shown in Fig. 2 together with contours representing confidence intervals. If the measurement is repeated a large number of times, in 68% (95%) of the times the result will fall within 1σ (2σ) confidence interval.
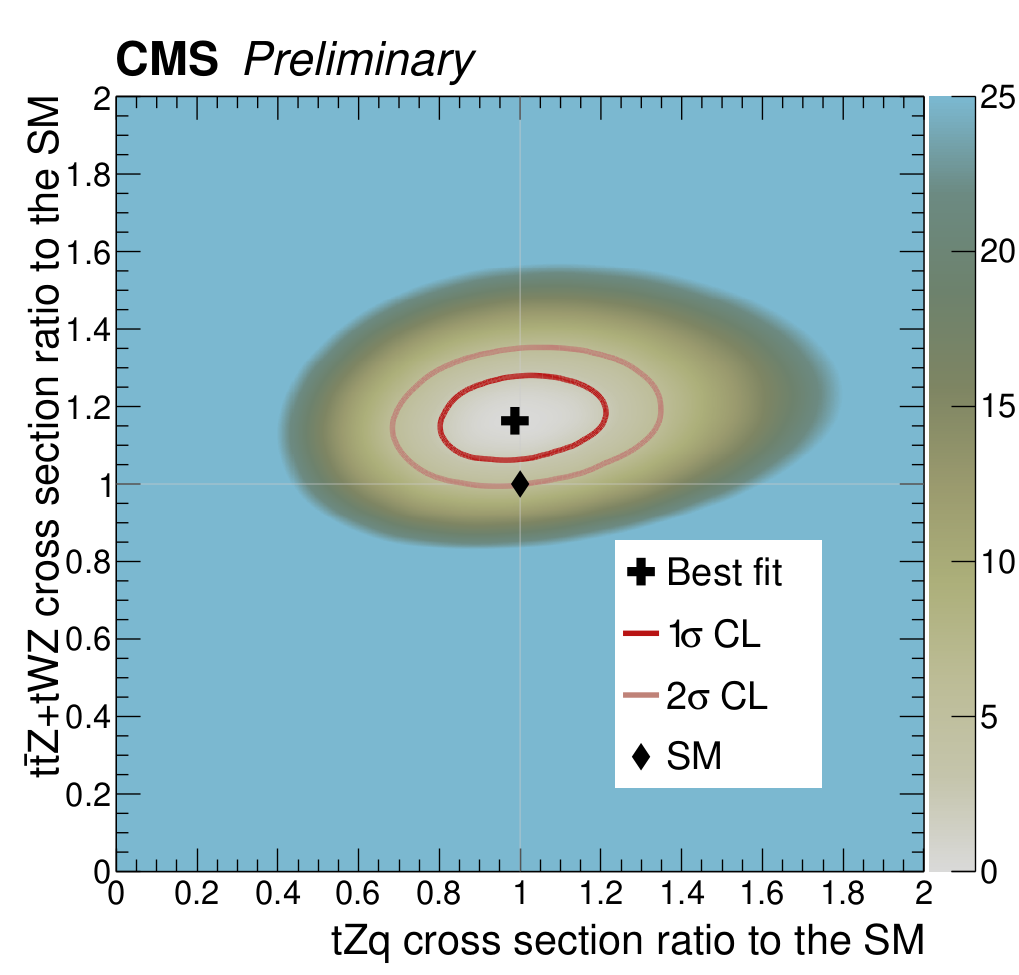
Figure 2: Two-dimensional scan illustrating the behaviour of the parameters in our statistical model. The cross indicates the combination of parameters that gives the best description of the data. The dark red contour corresponds to the 68% confidence interval of the measurement while the 95% confidence interval is shown by the light red contour.
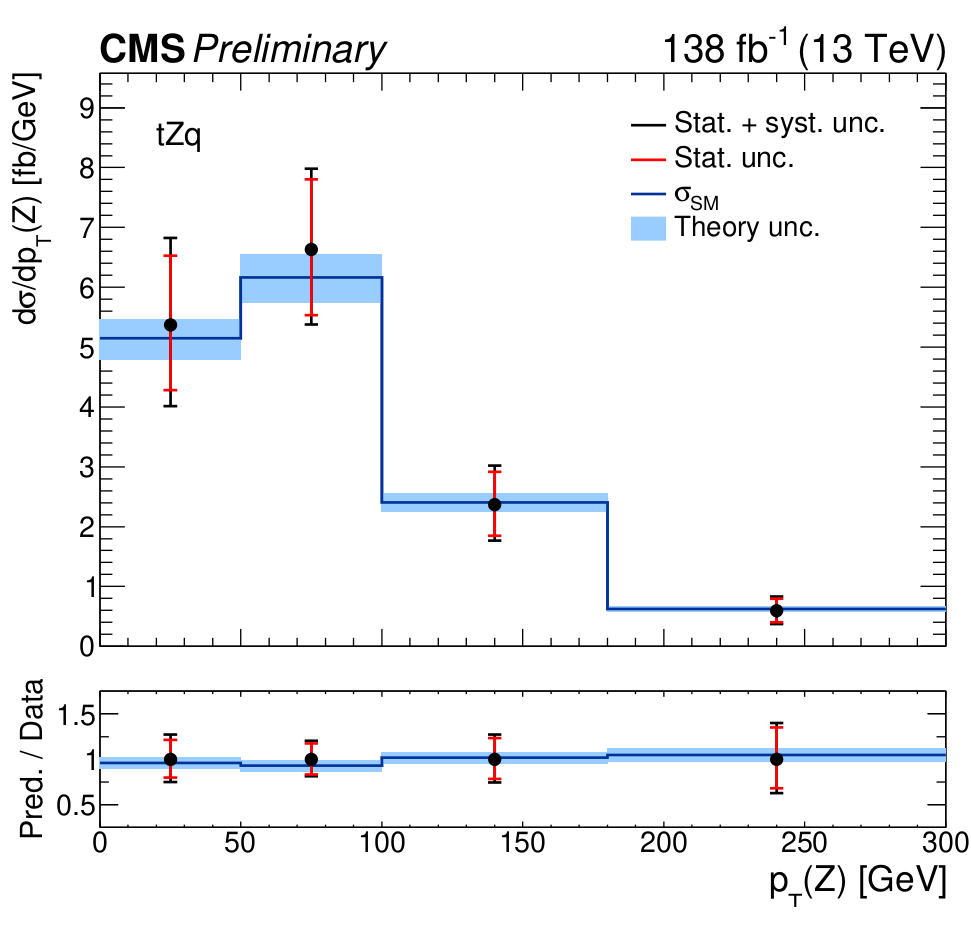
We also measured the cross sections of our signals differentially as a function of five different observables. With differential measurements, we can understand how the cross sections vary as a function of a specific kinematic variable and identify the source of possible discrepancies between data and predictions. As an example, the signal cross sections as a function of the transverse momentum of the Z boson are shown in Fig. 3.
 |
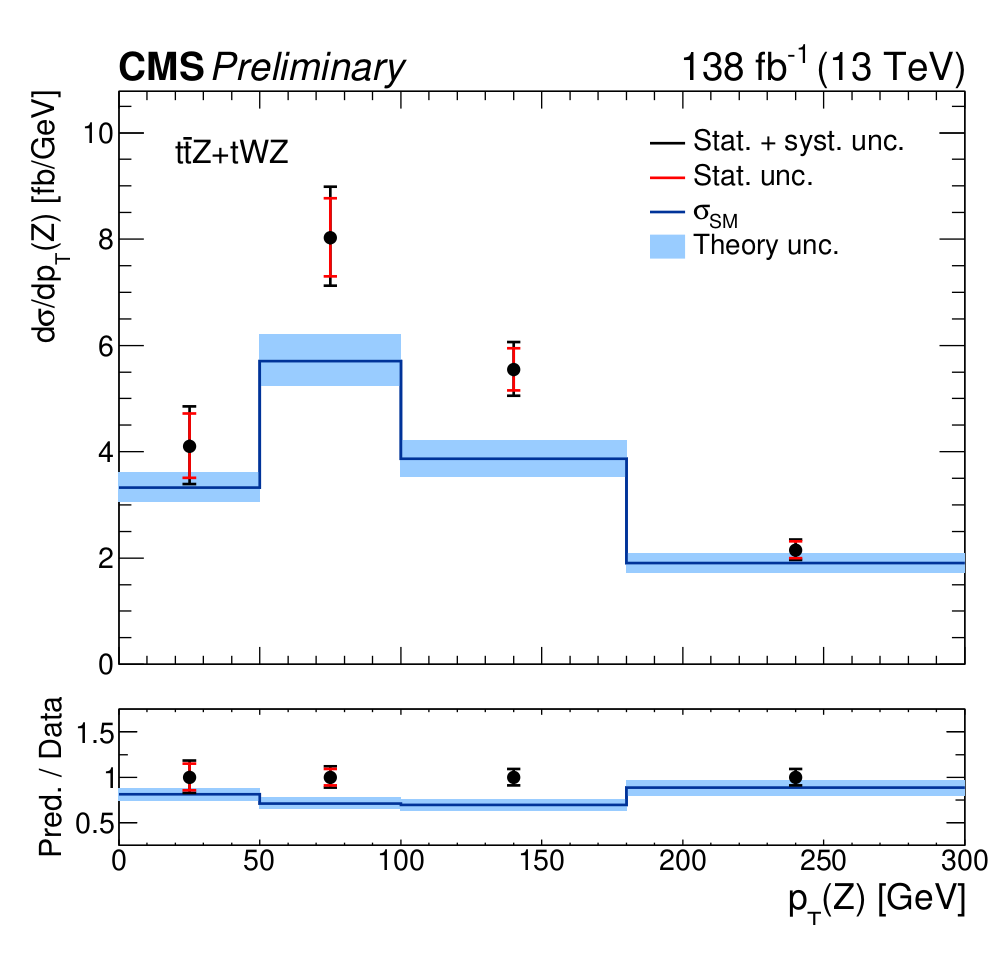 |
Figure 3: Differential cross sections of tZq (left) and ttZ+tWZ (right) as a function of the transverse momentum of the Z boson. The red lines represent the statistical uncertainties while the black ones also include the systematic uncertainties. The width of the blue bands indicates the uncertainty of the theory predictions.
Our measurements show a good agreement with SM expectations for the tZq process, while we observe a small excess for the sum of the ttZ and tWZ processes. These results offer a valuable starting point for theorists and experimentalists to identify the potential causes of the excess seen. Furthermore, with the forthcoming data from the LHC Run 3, the statistical uncertainties are expected to become subdominant and the precision of this measurement will improve significantly. This will enhance our understanding of the interactions involving the top quark, deepening our comprehension of fundamental particle physics.
Read more about these results:
-
CMS Physics Analysis Summary (TOP-23-004) "Inclusive and differential measurement of top quark cross sections in association with a Z boson "
-
Display of collision events: CERN CDS
-
@CMSExperiment on social media: LinkedIn - facebook - twitter - instagram
- Do you like these briefings and want to get an email notification when there is a new one? Subscribe here