
Tag: infographic
-
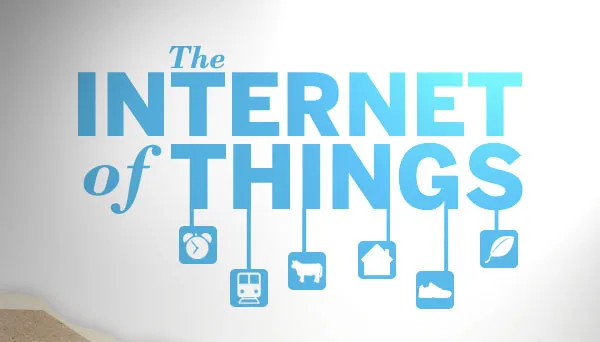
Infographic: More “Things” than People on the internet.
Came across this excellent infographic and I thought I’d share it with the rest of you: http://blogs.cisco.com/news/the-internet-of-things-infographic/
Came across this excellent infographic and I thought I’d share it with the rest of you: http://blogs.cisco.com/news/the-internet-of-things-infographic/