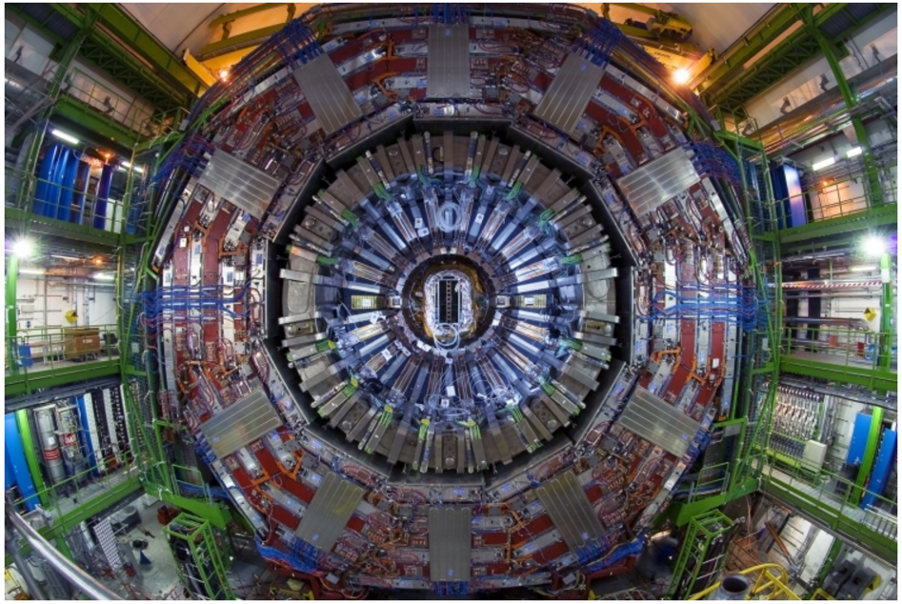
From time to time, we need to take our cars in for a checkup to make sure everything is up to speed, and here we check up on how well our CMS detector is working. The CMS detector is one of the main detectors at the Large Hadron Collider (LHC) at CERN, which is one of the most amazing machines ever built. It smashes particles into each other at almost the speed of light as they travel around a huge, circular, underground racetrack (27 km or 17 mi around). Our detector’s middle name is “muon” (a super heavy cousin of the electron) because it was designed to be especially good at measuring them. So for this checkup on the performance of the CMS detector we focus on the measurement of muons.
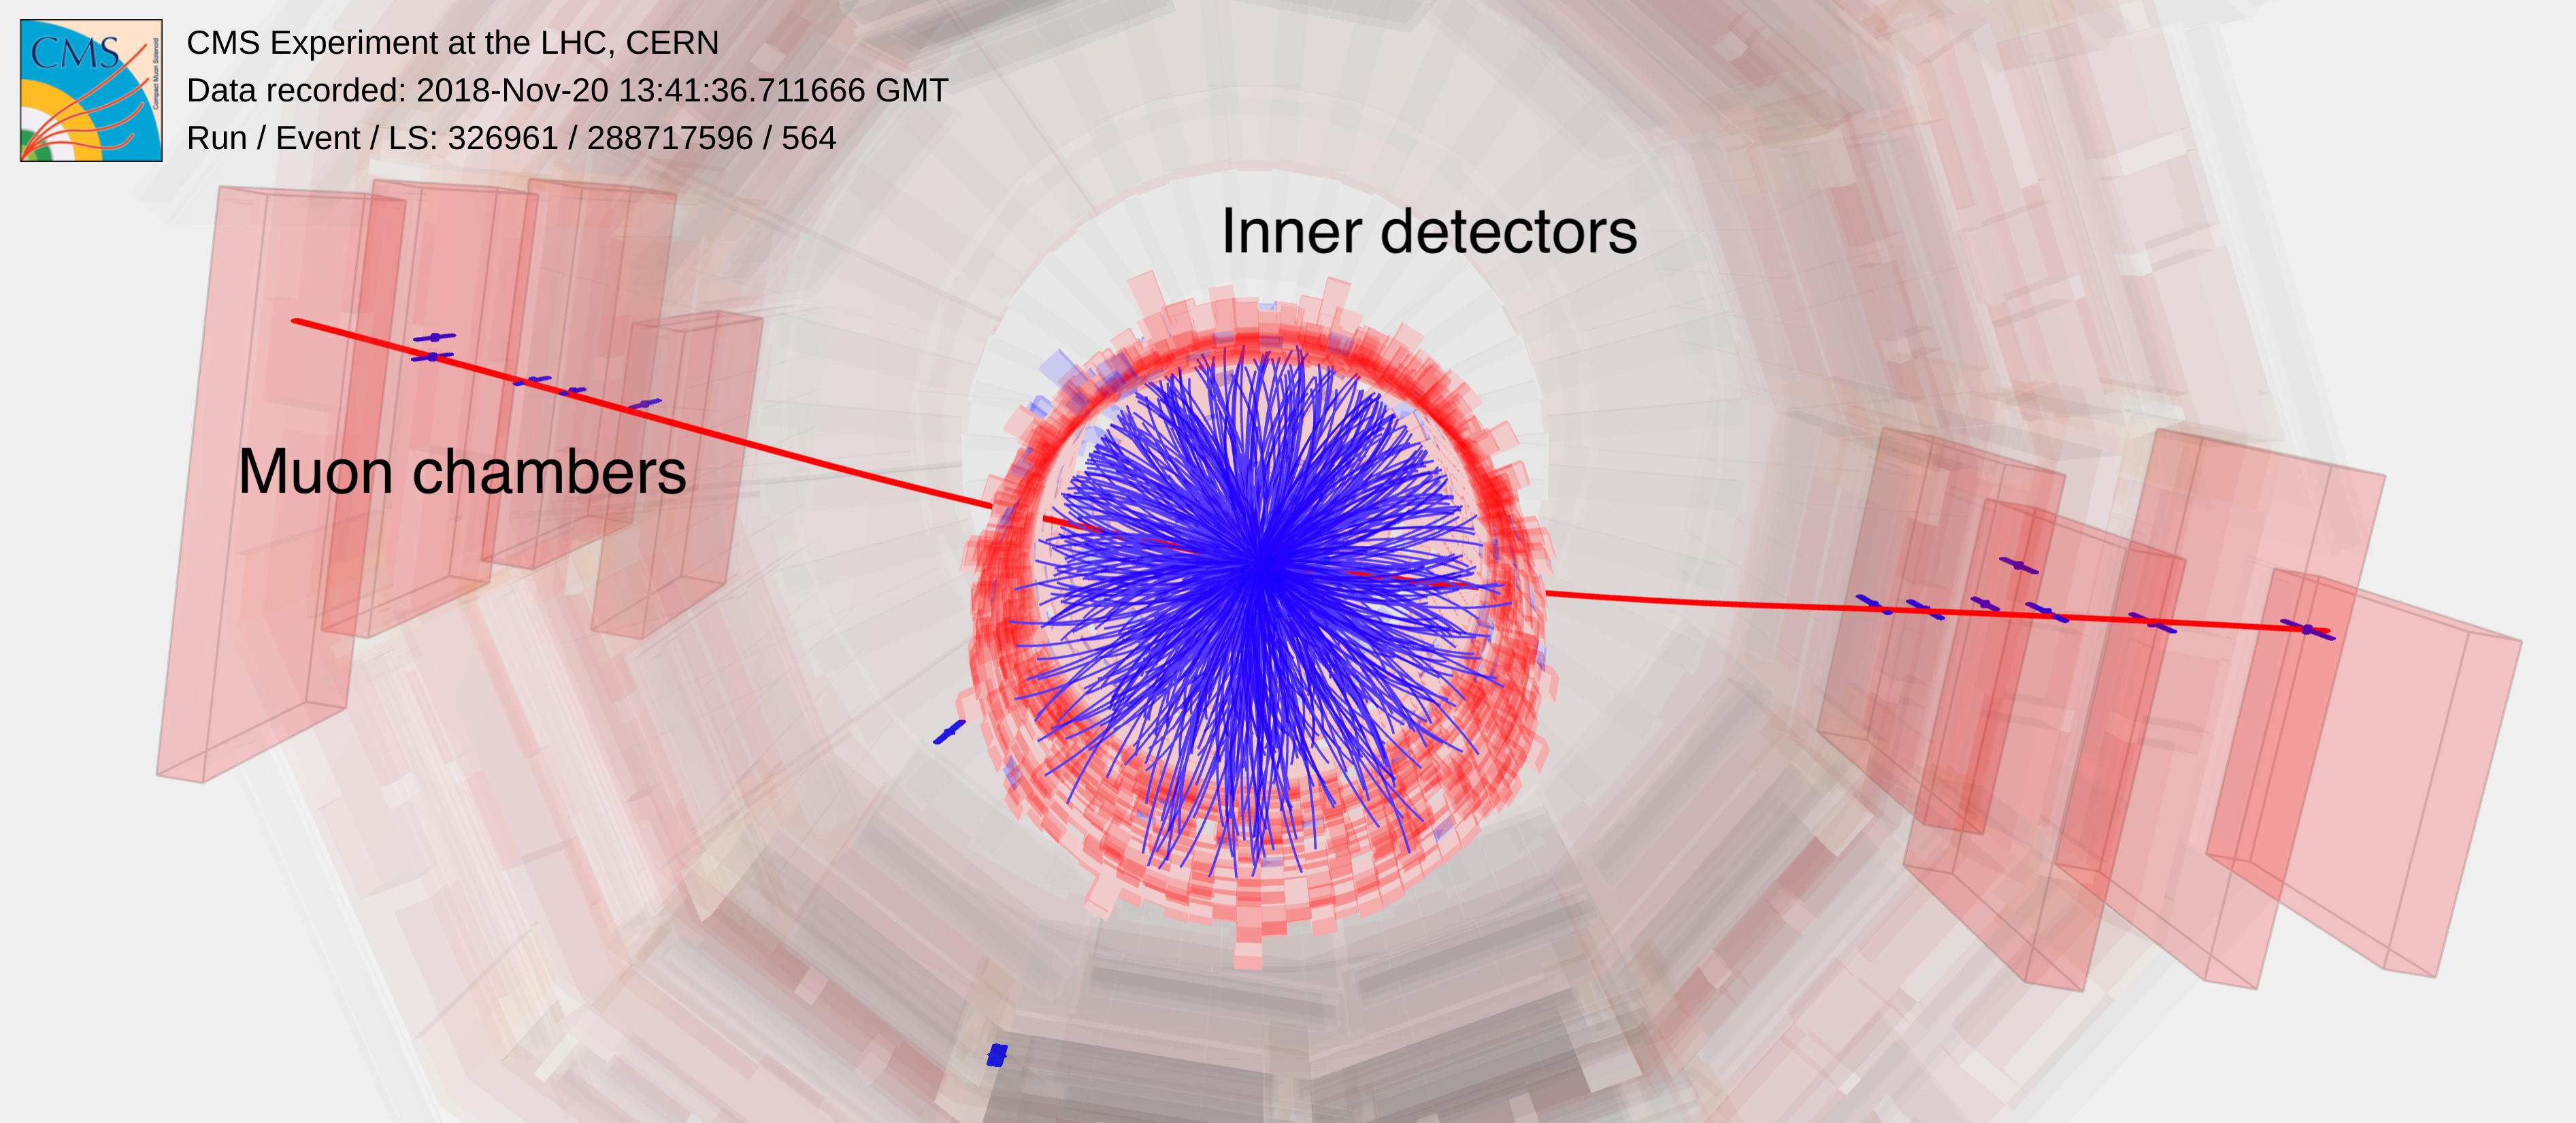
Figure 1: A heavy ion lead-lead collision in the CMS detector. Thousands of charged-particle tracks (blue) are seen in the inner detectors: silicon detector layers inside the CMS magnet. Most particles do not reach the muon chambers, placed outside of the magnet (not shown in this figure). The muons are the exception, as shown by the red tracks.
One of the ways we can check up on our detector is to compare the results from different types of collisions. During the LHC Run 2 (2016-2018), we gathered three sets of data from 3 types of collisions: proton-proton, which produce the fewest particles (and have a long history of success); proton-lead, which are in the middle; and lead-lead, which produce the most particles. Head-on lead-lead collisions produce the toughest conditions for our detector, as one head-on lead-lead collision is equivalent to thousands of proton-proton collisions. Figure 1 shows a picture of a collision of massive lead nuclei. The blue lines come from the thousands of particles that are produced from this violent collision. The two red lines come from muons. These lines are like tire tracks that tell us where, and how far, the muons have traveled. We like muons because they are the only visible particle that passes through all the layers of our detector, making them easy to detect. They can help us understand the hot and extremely dense matter that is created in a lead-lead collision – the same matter that existed at the beginning of the universe. And this environment is much hotter than the center of the sun, about 100 000 times hotter!
We check on how well our detector finds muons by using a measurement called "efficiency”. This measurement tells us how often we find a muon out of a certain set of possible muons. No one wants to miss out on an interesting discovery because we lost a muon that we could have detected! So an efficiency close to 100% is our goal. For our checkup, we are interested in the efficiency of various ways to find muons. One way is to make sure that, as muons pass through the many layers of the detector, we can connect the various segments, such as matching the track segments from the muon chambers in the outer part of the detector back to the same track segments in the inner parts of the detector.
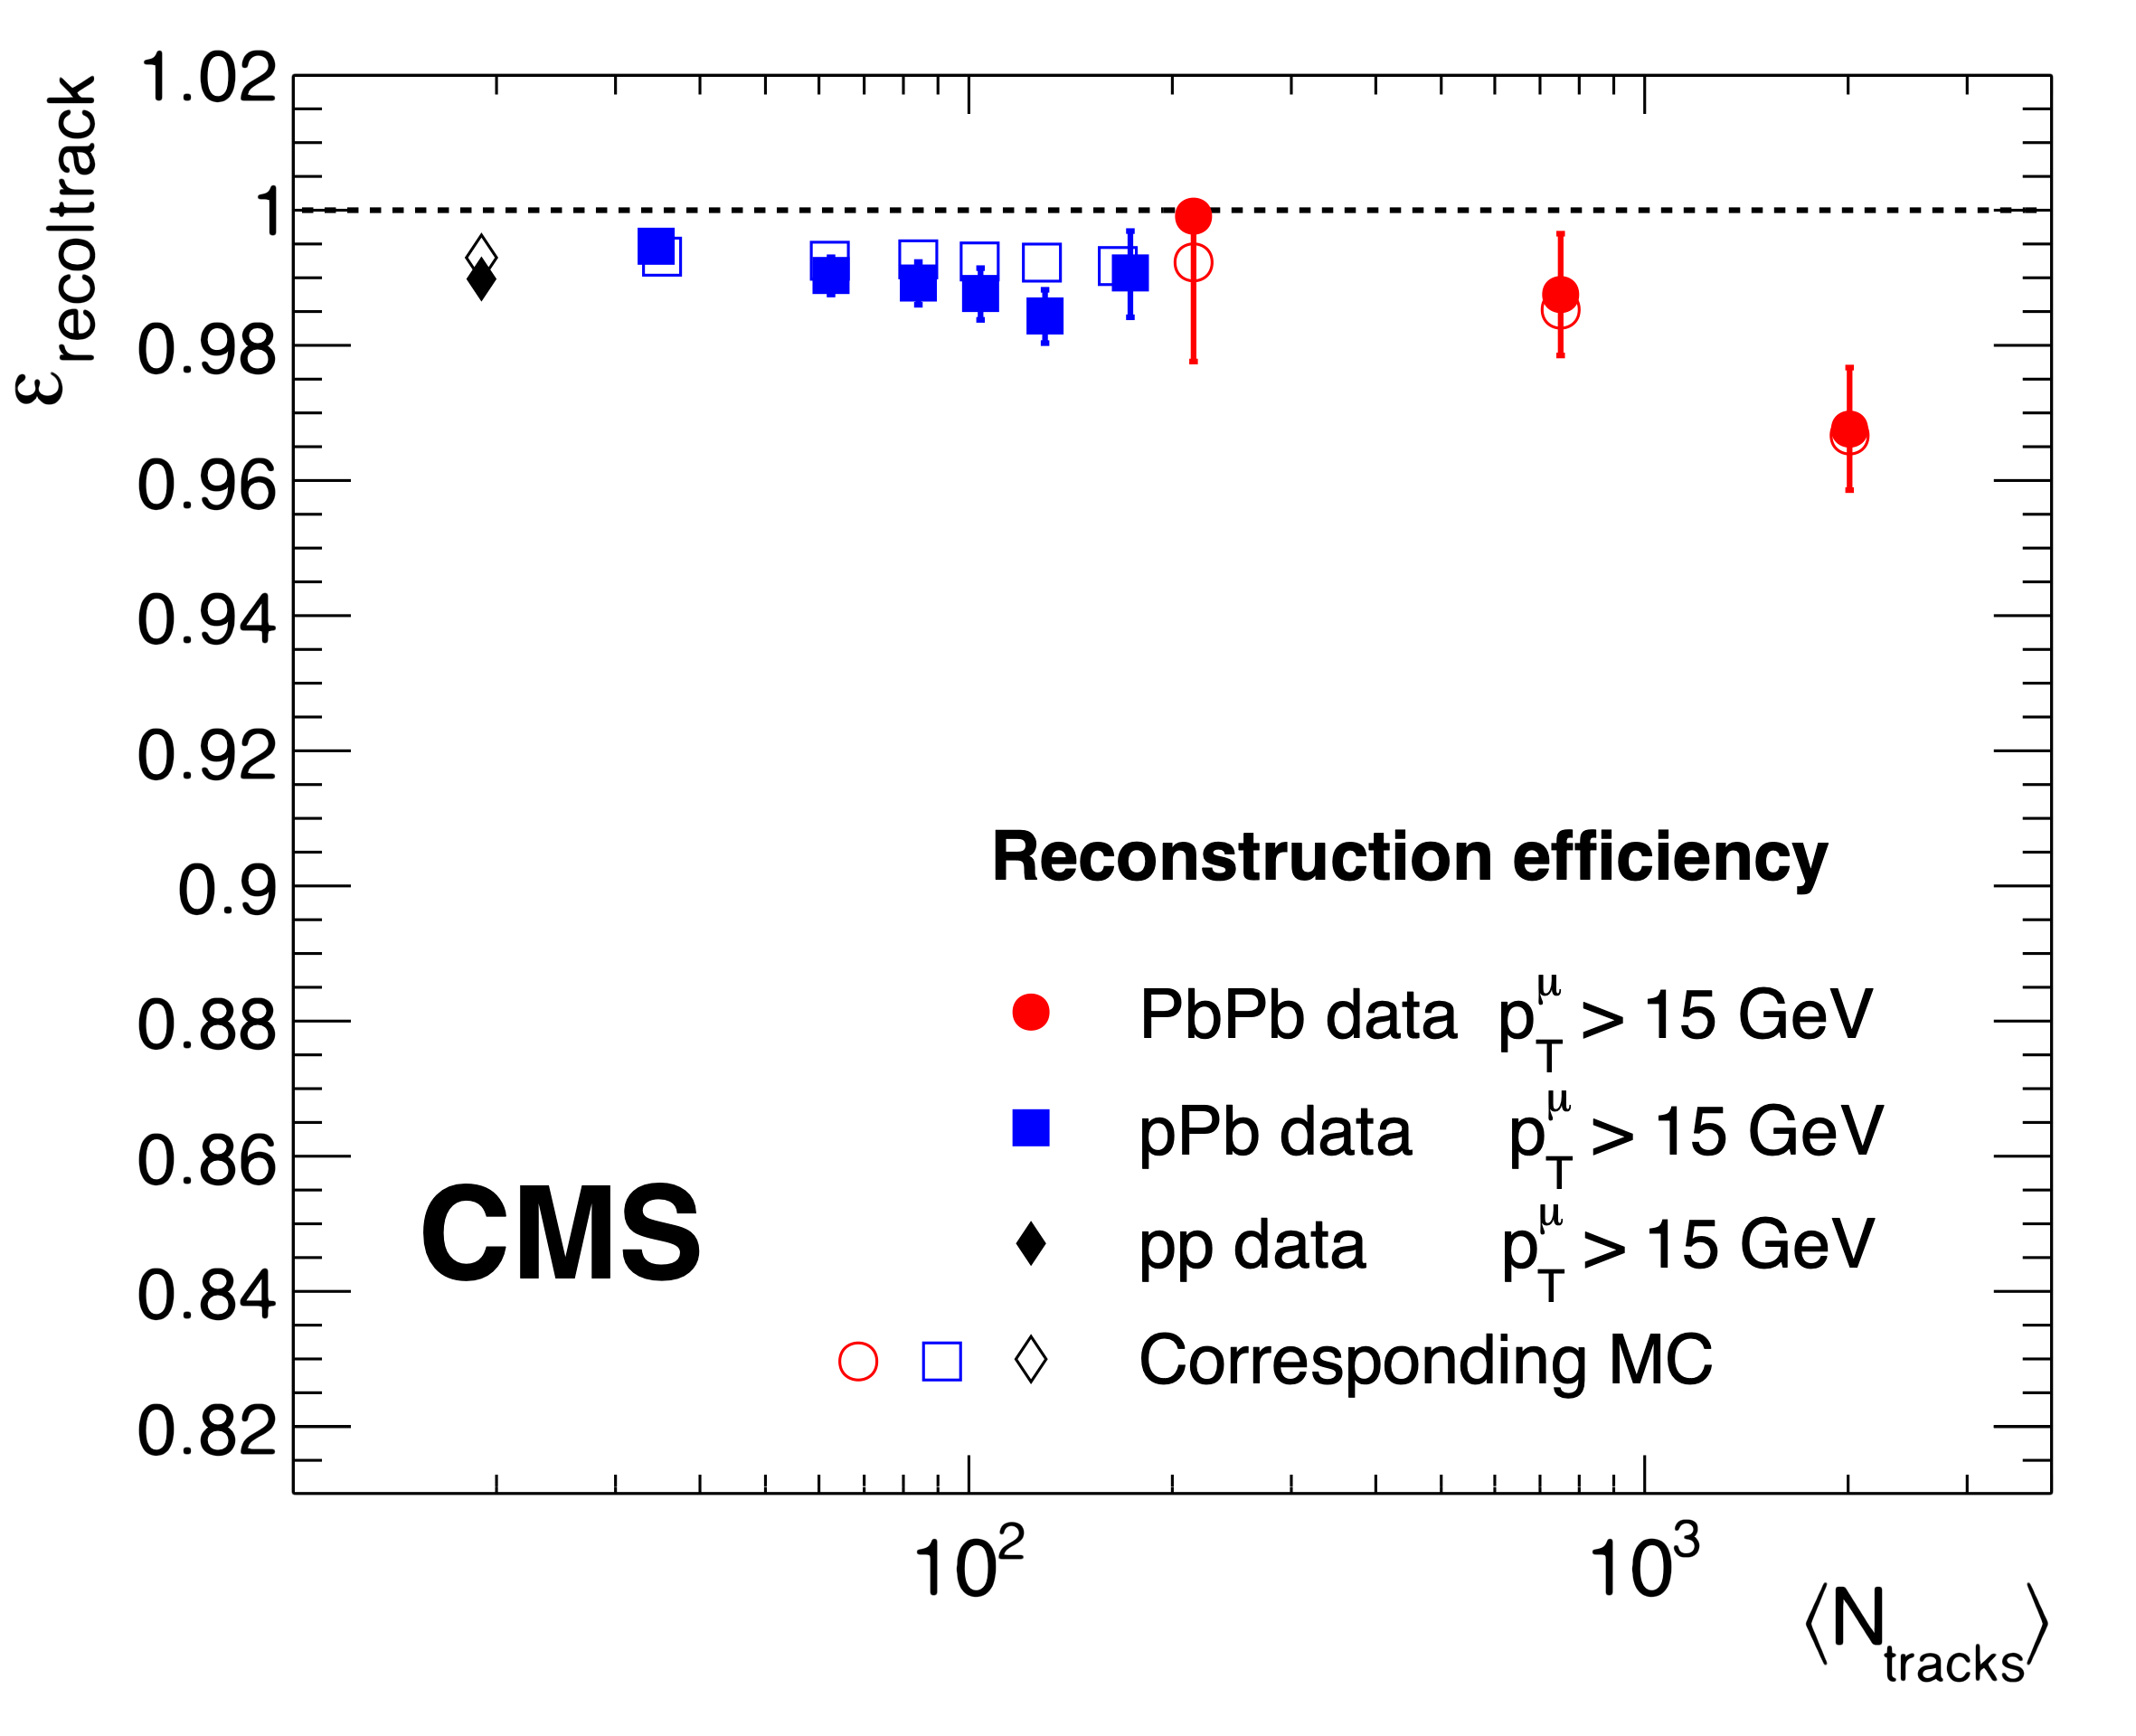
Figure 2: One of the main results of our study: the efficiency for matching muon segments from the outside to the inside of the detector. We see that the efficiency is good for all of our collision data: proton-proton, proton-lead, and lead-lead. MC refers to results from the computer mockup.
An example of how well we succeeded at this matching is shown in Fig. 2. In this graph the vertical scale shows the efficiency of matching the muon chamber information to the inner detector layers; the horizontal scale shows the total number of tracks seen in the event. The proton-proton collisions, shown as a black diamond, have the lowest number of tracks, about 20; the proton-lead collisions, shown as blue squares, increase the number of tracks seen in the event to about 200; the lead-lead collisions, shown as red circles, span the range from 200 to 2000 tracks. While the number of tracks increases by a factor of 100, the efficiency stays high, above 96%, across the whole sample. For all collision systems, we use a computer program to make a mockup of how the muons behave as they go through our detector. Then we compare the results of the mockup with the results we actually recorded in the experiment. The results of the computer mockup (the hollow diamonds, squares, and circles) agree with what we actually see in our experiment. “Our analysis showed that the detector passed its checkup with flying colors! I am excited to see that we are in good shape for analyzing the heavy-ion data we got from the run in the fall of 2023”, said Ota Kukral, who worked on this analysis during his PhD at the University of California, Davis.
In the future (2029), the LHC has a bigger upgrade in the works. It will add two words to its name and be called the High Luminosity Large Hadron Collider. The upgrade will allow super high collision rates. But, thanks to our checkup, we know that our CMS detector, like a well-tuned race car, will be firing on all cylinders when we start taking data at the new high luminosity racetrack.
Read more about these results:
-
CMS Paper (MUO-21-001): " Performance of CMS muon reconstruction from proton-proton to heavy ion collisions "
-
@CMSExperiment on social media: LinkedIn - facebook - twitter - instagram
- Do you like these briefings and want to get an email notification when there is a new one? Subscribe here