The standard model of particle physics (SM) is one of the most precise theories ever conceived, capable of predicting certain quantities with up to 14 digits of precision. The LHC is a marvel of modern experimental physics and precision engineering, able to further test the SM by probing energy scales not seen since the universe was less than a second old. But what happens when these two masterpieces still aren’t enough? Modern cosmology suggests that the universe is made up of approximately 5% ordinary matter (what the SM predicts and what all the colliders have probed), 27% dark matter (responsible for galactic structures), and 68% dark energy (responsible for the accelerating expansion of the universe). In order to understand the majority of the energy content of the universe in terms of a quantum theory, new particles must be postulated. However, since the discovery of the Higgs boson in 2012, the LHC has not shown any clear signs of new particles beyond the SM. With this effort, we have learned a lot about what new physics doesn't look like, but we still have no evidence of its existence. This naturally leads to the question: what if these proposed new particles are more massive than what the LHC can produce? Do we simply have to sit and wait decades until the next generation of particle colliders start operating? Fortunately, a quirk of quantum field theory may allow us to still detect the telltale signatures of these illusive new particles.
The SM is a perturbative theory, meaning certain approximations can be made while disregarding vanishingly small corrections to the precision of a calculation. These corrections may be interpreted as virtual particles (don’t let the name fool you, these are mathematical tricks, and are likely not real particles): the underlying quantum fields may “borrow” energy from the vacuum state of the universe, as long as they “pay it back” in a sufficiently short amount of time. This is known as an off-shell process, and is the staple of many SM processes including the decay of a muon via an off-shell W boson into an electron, an antielectron neutrino, and a muon neutrino. A framework known as effective field theory (EFT) allows us to treat the SM as a low-order approximation of a more complete theory. The robust nature of EFT doesn’t even require an ansatz for the exact theory. Instead, using only the tools of the SM, one may construct an EFT model where new physics couples together the existing pieces of the SM in some novel way. This model would leave telltale signatures in the various LHC experiments as excesses or deficits of data collected when compared to the SM prediction. This is exactly what the CMS collaboration is attempting to measure.
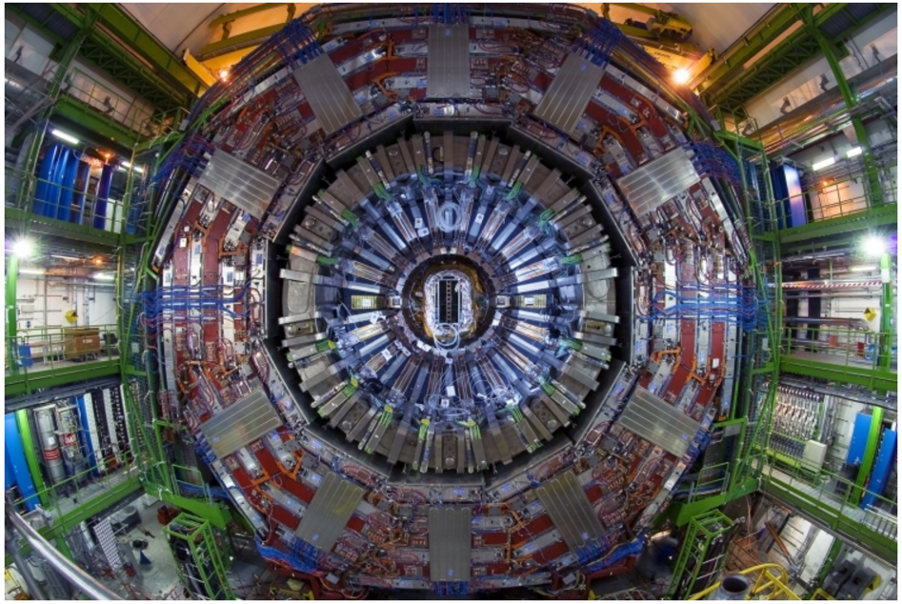
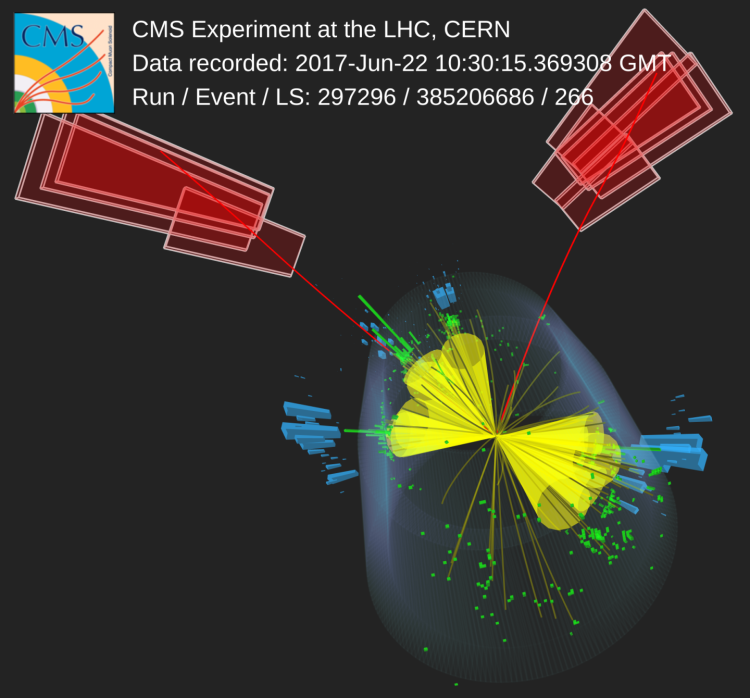
The top quark is the most massive of the fundamental particles in the SM. It is produced in abundance at the LHC by colliding protons together, and its decays leave very recognizable signatures in the CMS detector. This is because the top quark almost immediately decays into a bottom quark and a W boson, which in turn can decay in several different ways. In particular, the W boson can decay into a charged lepton (electron or muon) and a neutrino, as shown in Fig. 1. As neutrinos are not charged, and interact very weakly, they tend to pass right through the detector. Quarks produce a spray of particles known as jets. Jets from bottom quarks are rather unique, and are used to flag possible decays of top quarks (among other things). Production of top quarks, both in pairs and alone, is well studied. Rarer occurrences, such as top quarks (single, pairs, and even four at once) produced with additional heavy (W, Z, and Higgs) bosons, are not as well studied, and are therefore of interest in these types of searches.

Figure 1: The event signature depicted in this image is consistent with production of four top quarks. Two muons (represented by the red lines) are produced from the leptonic decay of two of the top quarks and other two top quarks decay hadronically, producing jets (represented by the yellow cones).
The new CMS analysis uses data collected during the years 2016–2018 at a center-of-mass energy of 13 TeV. The analysis looks for the collisions in which one or more top quarks are created along with additional heavy bosons, which must decay into at least two detectable leptons. The EFT model we have used provides a large number of knobs that can be adjusted to change the predicted yields; this analysis is sensitive to 26 of them. Unfortunately, we do not currently have enough data to confidently identify the values that the knobs were set to in our universe. However, we can use statistical inference to find a reasonable range in which we’d expect future measurements to find the correct answer. This inference is further complicated by a number of uncertainties related to how the data is collected, as well as the finite precision of the CMS detector. These uncertainties further smear the ranges which we can probe. The analysis uses a range of sophisticated techniques to leverage our sensitivity, including investigating how the EFT model redistributes the energy provided by the colliding protons. The data and EFT predictions are divided into 178 distinct categories (Fig. 2), and the complex interplay between these categories are carefully monitored and accounted for. In the end, a score is tabulated (Fig. 3) based on how much each knob affects both the total prediction as well as individually simulated processes. This score helps us determine how compatible the data is with our model, and this helps determine the ranges mentioned above. These ranges will help theorists and experimentalists better determine which proposed theories should be explored further, and which are inconsistent with the universe around us.

Figure 2: A plot of the number of collisions selected in the data (black dots with error bars) versus the yields predicted in our model (colored columns). The y-axis is the so-called number of events, or collisions found. The x-axis shows the various subcategories of the events based on the number of leptons, the total charge of the leptons, the number of total jets, the number of bottom quark jets, and the relative distribution of energy. The animation scans through a subset of possible values.

Figure 3: An example of the score when tuning two knobs at once: one for ctW (x-axis) and one for ctZ (y-axis). The colored lines represent the boundaries at which the knobs are still compatible with the data to varying degrees of probability. The tilt of the ellipse indicates a large correlation between the two knobs.
Read more about these results:
-
CMS Publication (TOP-22-006): "Search for physics beyond the standard model in top quark production with additional leptons in the context of effective field theory"
-
Display of collision events: CERN CDS
-
@CMSExperiment on social media: Bluesky - Facebook - Instagram - LinkedIn - TikTok - Twitter/X - YouTube