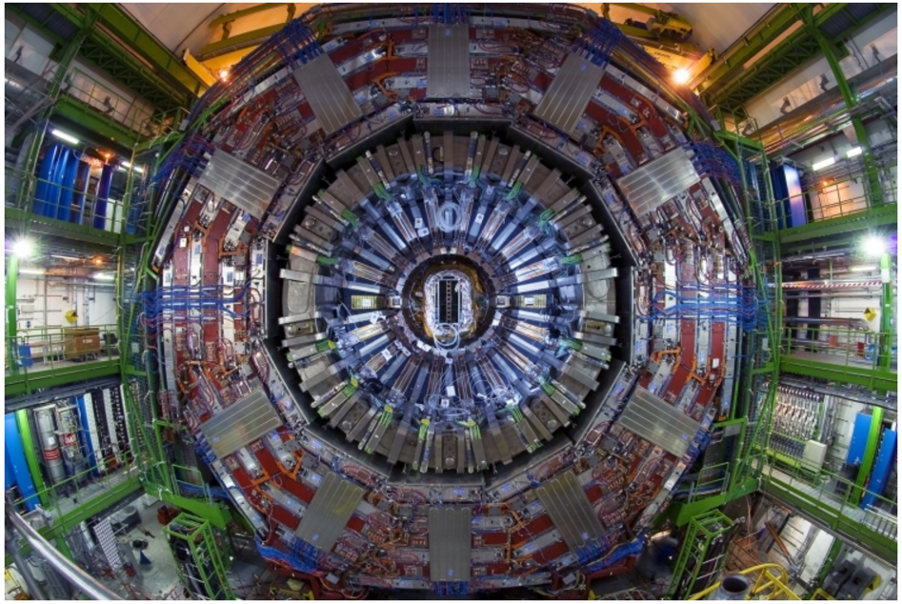
 and two jets (yellow cones) produced in a 13 TeV proton-proton collision in 2018.")
In 2012, the ATLAS and CMS Collaborations observed a new boson with a mass of 125 GeV, whose properties are compatible with those of the Higgs boson predicted by the Standard Model (SM) of particle physics. However, numerous models beyond the SM (BSM) predict the existence of several Higgs bosons, at least one of which could be lighter than 125 GeV. The discovery of a second Higgs boson would mean that the Higgs field gives mass to all the other particles in a more complex way than assumed in the SM: it would be an unequivocal sign of new physics.
CMS has recently concluded a search for a Higgs boson in the 70–110 GeV mass range, using all the proton-proton data collected during the LHC Run 2 and exploiting the diphoton decay channel. To collect the highest possible number of events in the low mass region of the spectrum, new trigger algorithms were developed to maximize the probability of storing potential signal events while keeping the total event rates within the affordable data-acquisition bandwidth. To maximize the search sensitivity, the events were split in several categories, according to their resemblance to the expected signal, and multivariate analysis techniques were used for photon identification and event classification. For instance, Fig. 1 shows an event classified in the vector boson fusion category, with two photons and two jets in the final state.
The diphoton mass distributions, in all event classes, are simultaneously fitted with a fit model adding an hypothetical signal (“resonance”) to the expected processes (“background”). The fit is redone multiple times, each time shifting the position of the resonance in steps of 0.1 GeV. The absence of a visible peak provides a measure of the highest value (“upper limit”) that the production cross section of such a new resonance, times its diphoton decay branching fraction, can have: higher values would have left a visible signature in our data. The solid black line in Fig. 2 shows how this measured upper limit varies with the diphoton mass. The lowest values (i.e., the most stringent limits) are obtained where the background level is the smallest, so that even a small signal would be easy to see. The dashed black line, surrounded by its green and yellow uncertainty bands, shows what we were expecting to see in the absence of a second Higgs boson, given the size of our event samples and the simulated sensitivity of the search method, etc. We see that the solid curve is higher than the upper edge of the yellow band in the mass region around 95.4 GeV, which is an exciting indication that a BSM signal might be present in our event samples.
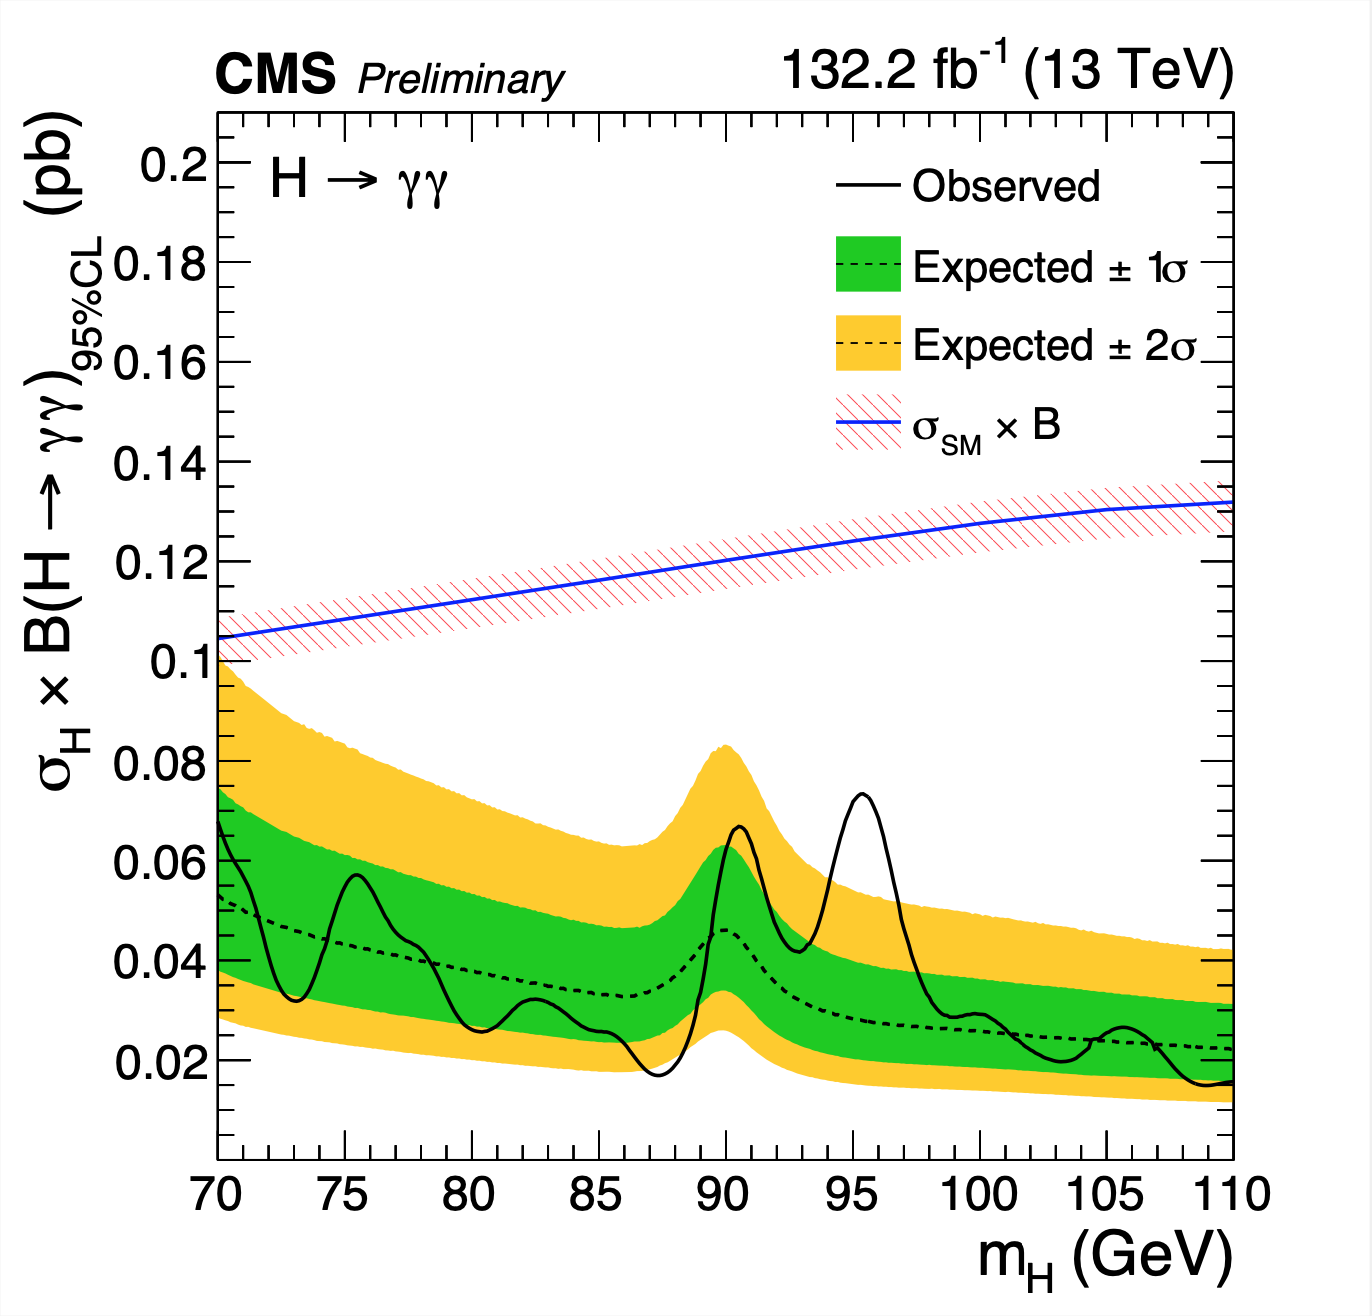
Figure 2: Expected and observed upper limits, at 95% confidence level, on the product of the production cross section and branching fraction into two photons for an additional SM-like Higgs boson.
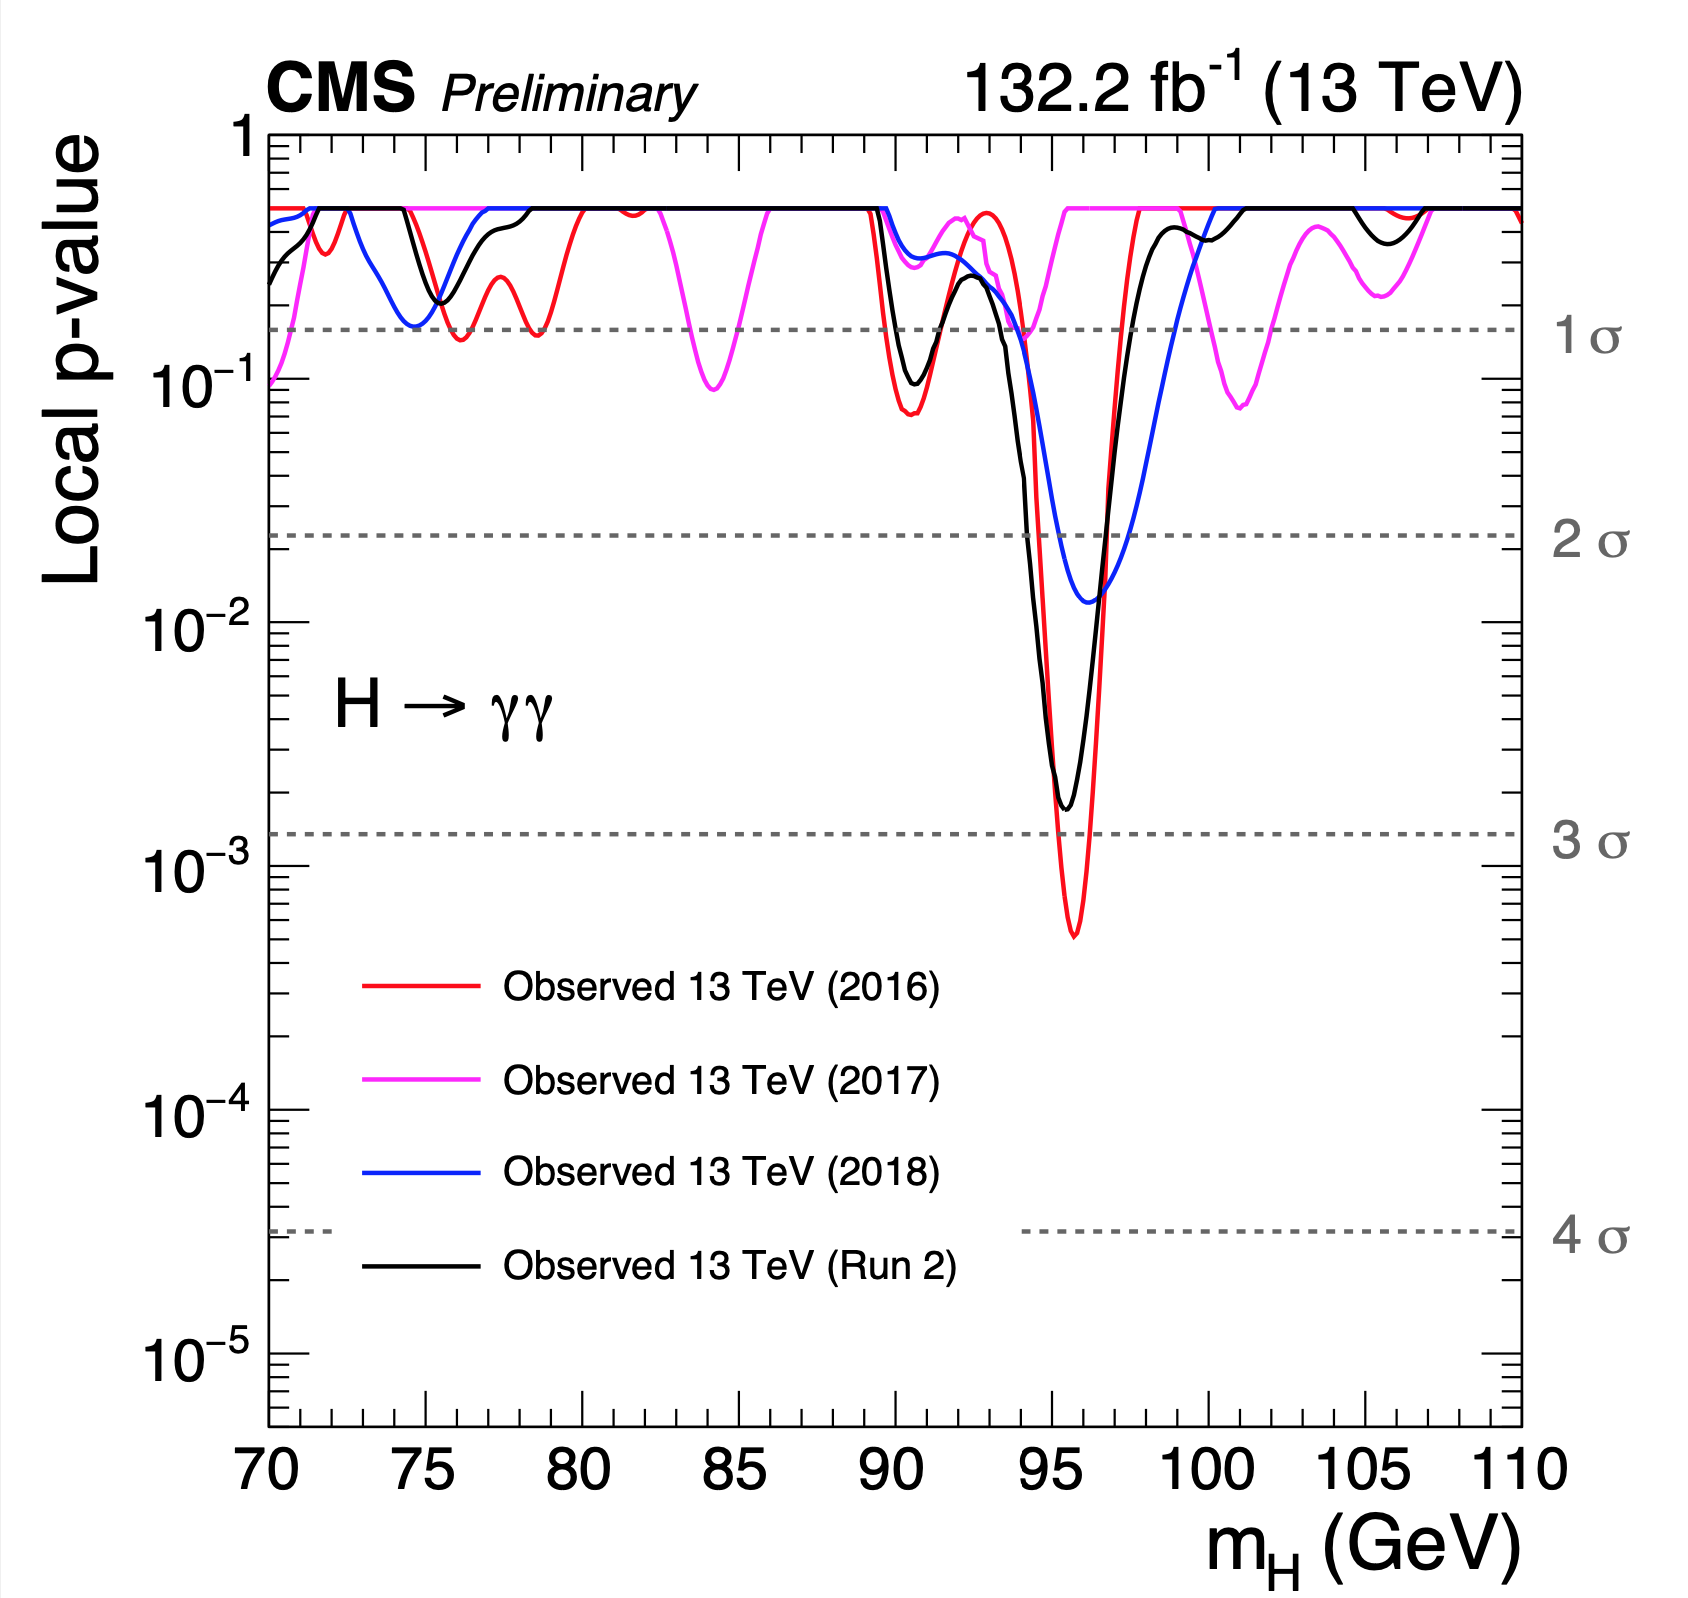
Figure 3: Probability that an additional Higgs boson is present in the Run 2 CMS data (black curve), presented in the form of local p-values (left axis) and of number of standard deviations (right axis), as a function of the mass of the new particle, mH.
Figure 3 presents the information of Fig. 2 in a more quantitative way, in the form of the “local p-value”, i.e., the probability that an excess in the observed distribution, with respect to the “background-only” fit model, is caused by a random statistical fluctuation of the background yield (and not by the presence of a new resonance). This value can also be expressed as the “significance” (number of standard deviations, shown on the right-side axis) that the excess is caused by a signal contribution. The excess seen at around 95.4 GeV has a local significance very close to the 3 standard deviations threshold traditionally used to claim “evidence” of a new signal. In other words, the probability that this excess is caused by a statistical fluctuation of the background is smaller than 1%. If we consider the fact that we could have seen a random excess anywhere in the search mass range, we get a “global significance” of
1.3 standard deviations. We are eager to see analogous results from other experiments and from the much larger Run 3 data samples.
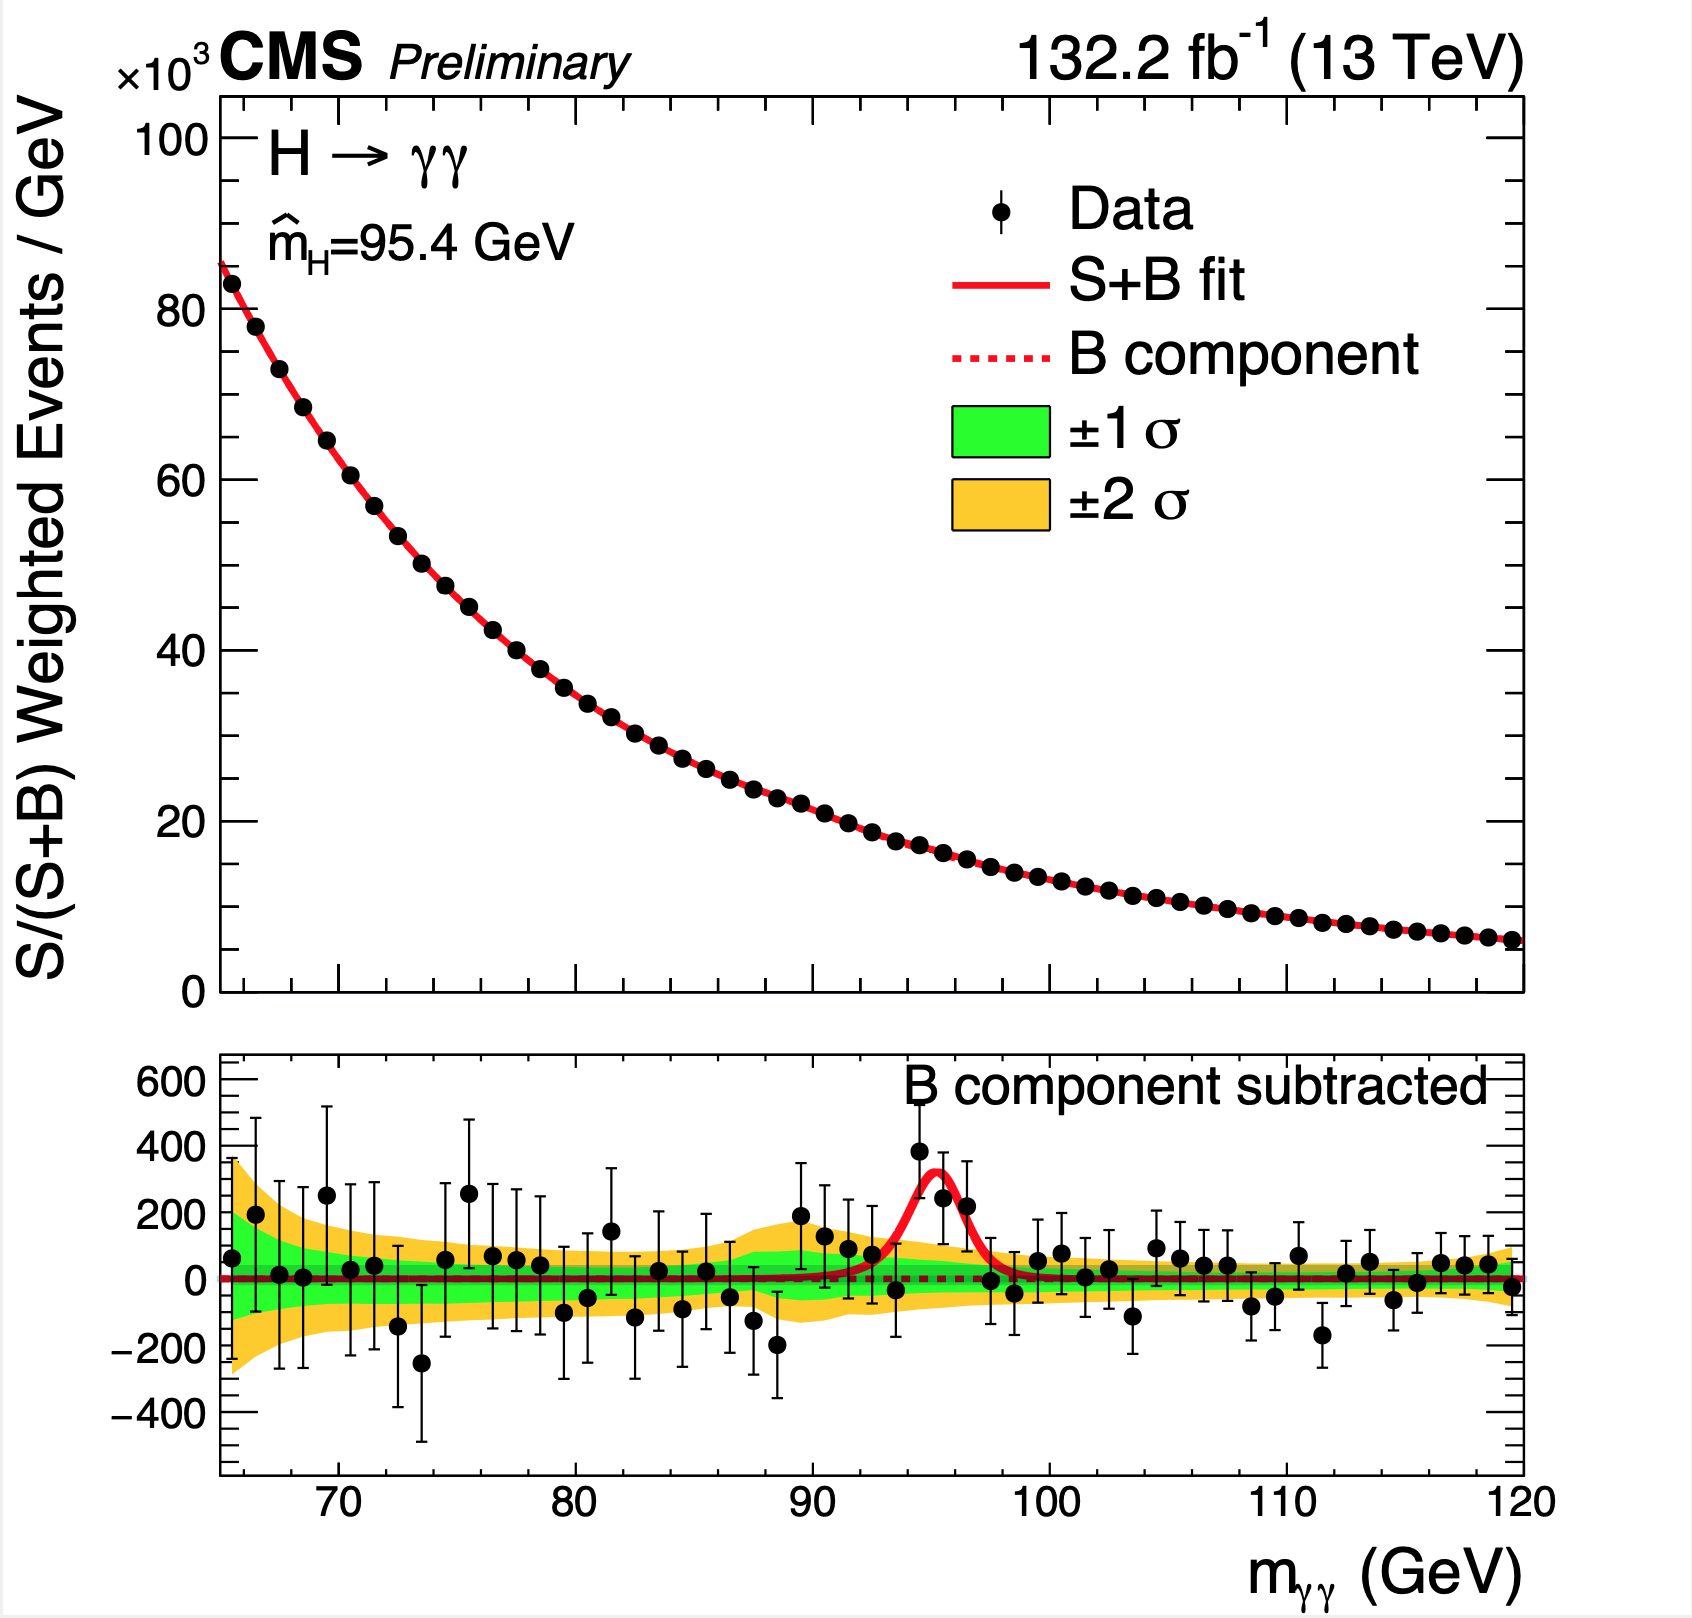
Figure 4: Diphoton mass distribution, together with the result of a fit including a signal with a mass of 95.4 GeV, easily seen in the background-subtracted distribution shown in the lower panel.
The diphoton mass distribution of all selected events is shown in Fig. 4, where each event has been weighted according to the expected signal to signal-plus-background ratio, S/(S+B), of its category. The result of a fit including a signal term with a mass of 95.4 GeV is also shown. The widths of the green and yellow bands represent the uncertainty of the fitted background term. After subtracting the background, we obtain the “signal-only” distribution shown in the lower panel, where an exciting hint of a new signal can be appreciated.
Read more about these results:
-
CMS Physics Analysis Summary "Search for a standard model-like Higgs boson in the mass range between 70 and 110 GeV in the diphoton final state in proton-proton collisions at √ s = 13 TeV"
-
@CMSExperiment on social media: facebook - twitter - instagram
- Do you like these briefings and want to get an email notification when there is a new one? Subscribe here