
The Bs meson is a bound state of a strange quark and a beauty antiquark – as such it possesses both beauty and strangeness! For many years, searches for an extremely rare decay of the Bs meson, to a μ+μ- pair, remained a holy grail of particle physics.
Why are searches for this rare decay so important? It is because the rate might be enhanced significantly by the presence of new particles, and this decay thereby offers excellent sensitivity to physics beyond the standard model (SM). The sensitivity to new physics rivals and might even exceed that of direct searches for new particles.
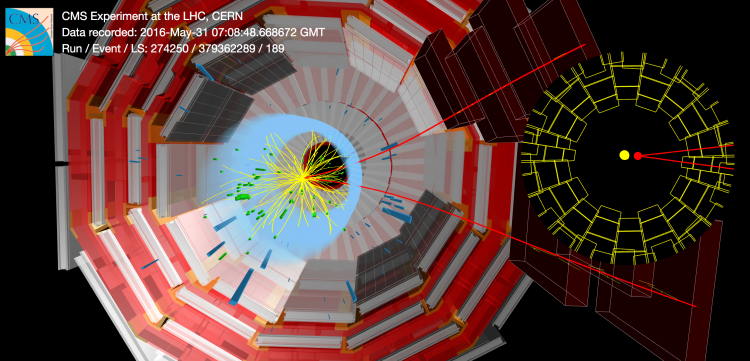
Figure 1: An event display of a Bs ⟶ μ+μ- candidate in Run 2 data. The two curved red lines correspond to the two muons from the decay. The inset zooms in on the innermost CMS detector region. The tracks other than the muon ones have been removed for clarity. The two muons come not from the collision point (yellow dot) but form a displaced vertex of the Bs meson decay. More event displays: https://cds.cern.ch/record/2684932
In the SM, the rate of this decay process is predicted to be only about 3.6 parts per billion (ppb). In watching a billion or more Bs mesons disintegrate, one would, therefore, observe only a mere handful of these events! The B0 meson, a lighter cousin of the Bs meson, made from a down quark and a beauty antiquark, is expected to decay to a μ+μ- pair even more rarely, about once every ten billion decays.
It took over a quarter-century of extensive effort to establish the Bs ⟶ μ+μ- decay. The first observation based on the LHC Run 1 data was presented in 2013, in a joint publication (Nature 522 (2015) 68) by the CMS and LHCb Collaborations.
Earlier this month, the CMS Collaboration updated its 2013 analysis and added the 2016 LHC Run 2 data (collected in 13 TeV proton-proton collisions, rather than at 7 and 8 TeV of Run 1). This new result allowed observation of the elusive Bs ⟶ μ+μ- decay with a significance of 5.6 standard deviations. The branching fraction was found to be consistent with the SM prediction, and thus no evidence for new physics was observed. There was no sign of the B0 ⟶ μ+μ- decay yet, but a stringent limit of less than 0.36 ppb was set on its rate.
 Figure 2: The reconstructed mass spectrum of the dimuon pair. The peaks corresponding to the Bs and B0 mesons are shown by hatched histograms, while dashed lines represent the various background components.
Moreover, CMS managed to measure the effective lifetime of the Bs meson, using the several dozen Bs ⟶ μ+μ- decay events that were observed. The interest in examining the Bs ⟶ μ+μ- lifetime is that, just as for the decay rate, new physics might alter its value from the SM expectation. This measurement yielded a lifetime of about 1.7 picoseconds, consistent with the SM. This is a very short lifetime: light will barely cross an eye of a fine needle in the time it takes the Bs meson to decay. The measured CMS value is consistent with the only other such lifetime measurement, which was presented by LHCb in 2017.
 Figure 3: The lifetime distribution of the observed Bs ⟶ μ+μ- candidates, fitted with a function that has the exponential shape expected for the lifetime of a particle. (The turnover of the function at very low lifetimes is an artifact of a selection requirement on the minimum decay length of the Bs meson.)
The new CMS measurement of the Bs ⟶ μ+μ- decay rate is consistent with the latest results from ATLAS and LHCb. While none of the experiments observe a significant deviation from the SM, all three results are found to lie slightly below the SM prediction. The slight deficit is not significant enough to be conclusive, but the trend is intriguing. If real, the trend may be related to so-called flavor anomalies recently observed by the LHCb experiment in other rare decays of B mesons. This makes this new Bs measurement even more exciting. With three times more Run 2 data still left to be analyzed by CMS, the next update—based on the full Run 1 and Run 2 data sets—may shed light on this puzzle. The future studies should also move us closer to the ultimate goal, which is the observation of the B0 ⟶ μ+μ- decays.
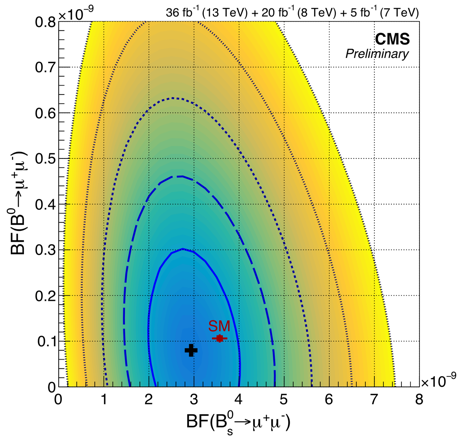
Figure 4: The two-dimensional probability contours representing the simultaneous measurement of the relative probabilities of the Bs ⟶ μ+μ- vs. B0 ⟶ μ+μ- decays; the various contours correspond to (innermost to outermost) 1, 2, 3, 4, and 5 standard deviations. The red point corresponds to the SM prediction, while the black cross represents the CMS measurement.
Read more about these results in the CMS Physics Analysis Summaries:
- Log in to post comments