The LHC circulates protons inside its beam-pipes not in a continuous stream but in several very closely packed bunches. In order to maximise the probability of the tiny protons colliding with one another, the LHC tries to pack as many protons as it can into the beam and squeeze it as narrowly as possible. The narrower the beam and the more protons in it, the higher the “luminosity” is.
Every time these bunches cross one another, more than one proton-proton collision takes place; this is known as pile-up. CMS has to observe the decay products of various particles produced in these collisions and work backwards to determine which collision interactions produced which particles. When CMS was designed and built, it was expected that there might be an average pile-up of around 25 interactions per crossing, with the proton bunches crossing inside CMS every 25 ns.
CMS however experiences pile-up of greater than 25 regularly, presenting new challenges to the CMS Tracker. Here’s why: At present, the LHC is operating at an instantaneous luminosity of 0.7 x 1034 cm−2s−1, which is lower than its design value of 1 x 1034 cm−2s−1. However, the proton bunches are spaced more widely — 50 ns instead of 25 ns. This increased separation means that there are more protons in each bunch than you would find in bunches that are more closely separated, resulting in a pile-up higher than 25.
In the CMS Tracker (made up of silicon pixels and strips), the number of hits grows linearly with pile-up. As these hits need to be combined into tracks, the number of possible combinations that make a track grows much faster than linearly with pile-up. Fortunately, the high granularity and efficiency of the Tracker provides the means to distinguish the many tracks in an event.
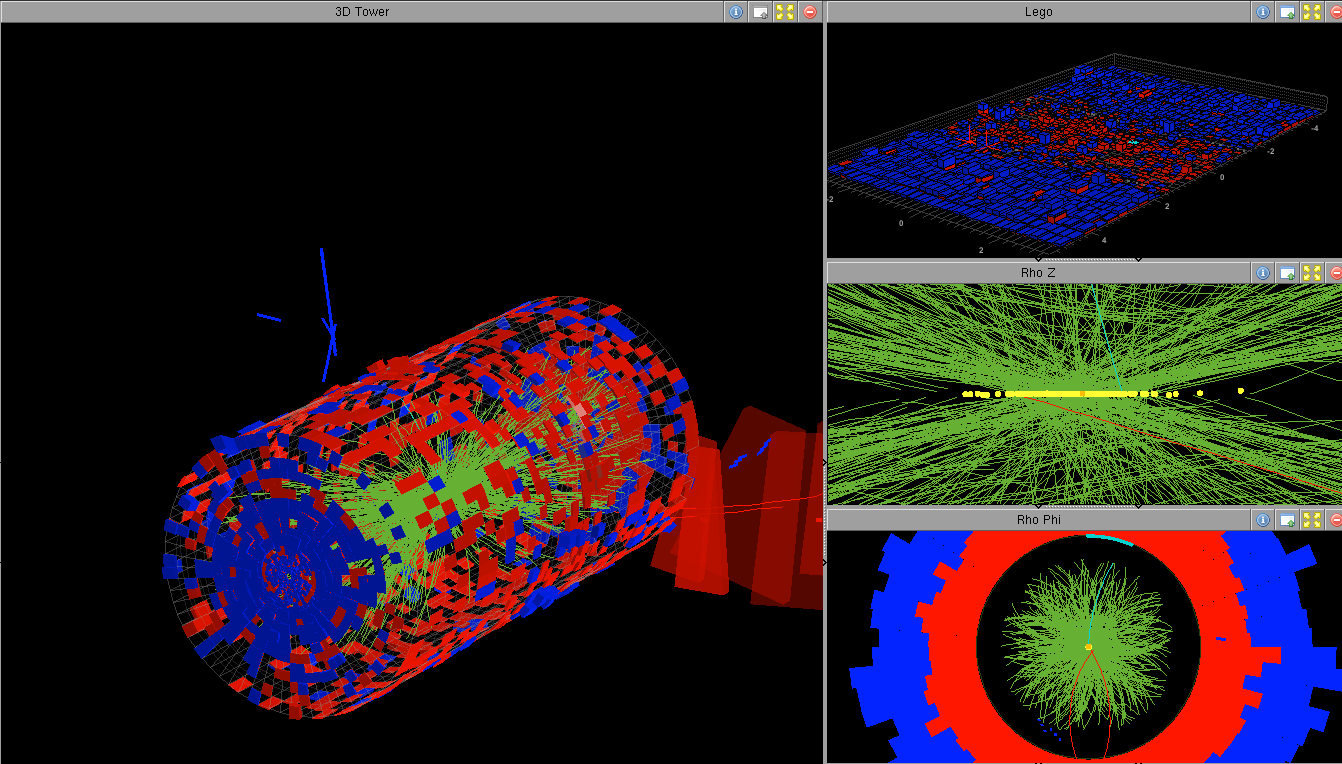
During the last two years, improvements have been made to the track reconstruction software to ensure that CMS can continue to reconstruct tracks with high purity efficiently and quickly, even under conditions of very high pile-up. Following the track reconstruction, the tracks are grouped into vertices, each one representing a proton-proton collision. Since only a few collisions reveal interesting physics, being able to distinguish tracks from different vertices is essential to disentangle the effect of pile-up collisions from the collision of interest. The exceptional performance of the Tracker can be seen in Image 1: the event display shows 78 reconstructed vertices in one beam crossing, obtained from a special high-pileup run. Images 2 and 3 display only the side-on or Rho-Z view, which shows how closely spaced the 78 collisions are. More images of this collision event may be found on CDS.
— Submitted by Kevin Stenson and Achintya Rao
- Log in to post comments

